Have you ever picked up a smartphone that feels instantly responsive, almost as if the screen is reading your mind, while another with similar specs feels slightly sluggish?
Many gadget enthusiasts focus on refresh rate, chipset, or display technology, but there is another invisible factor that often defines how a device truly feels in daily use and gaming: the touch sampling rate.
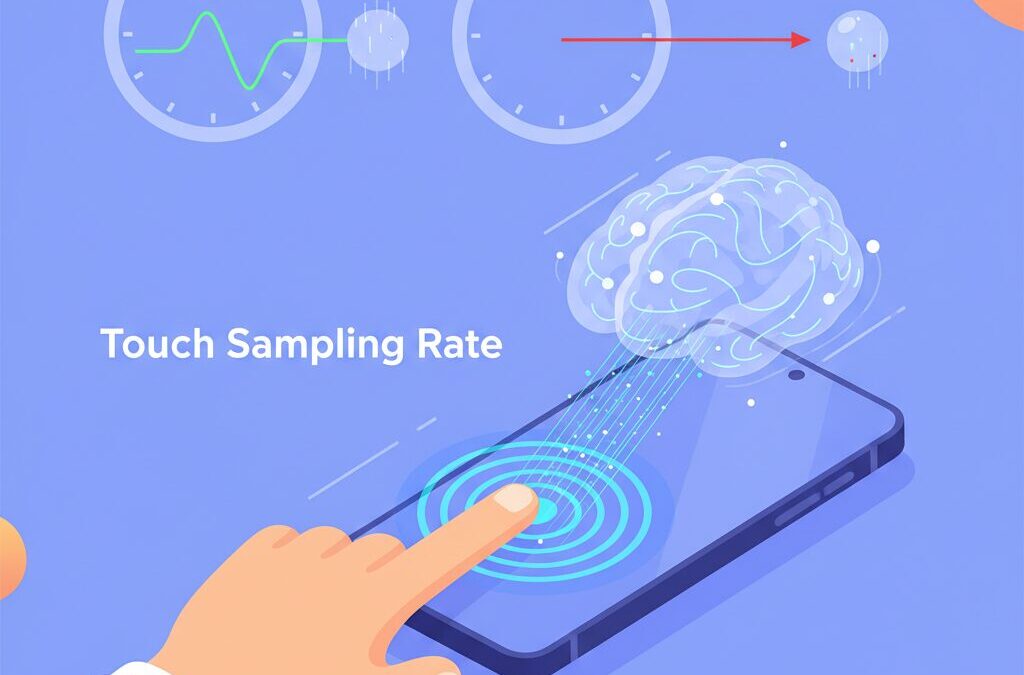
This metric determines how quickly your intention, expressed through your fingertip, is captured and delivered into the digital world.
In recent years, manufacturers have started advertising extreme numbers such as 720Hz, 960Hz, or even 2000Hz, especially on gaming smartphones.
However, higher numbers do not always translate into a better experience.
Understanding how touch sampling rate interacts with operating systems, game engines, display technology, and even human perception helps you separate meaningful performance from pure marketing.
In this article, you will learn why some phones feel smoother despite lower specs, how milliseconds shape competitive gaming, and how to choose the right device based on real-world responsiveness rather than spec sheet hype.
If you care about precision, speed, and the science behind great user experience, this guide will give you a clear and practical advantage.
- From Pixels to Time: Why Responsiveness Became the New Battlefield
- What Touch Sampling Rate Really Means and How It Differs from Refresh Rate
- Inside the Touch-to-Photon Pipeline: Where Every Millisecond Goes
- Gaming Phones vs Flagships: Different Philosophies of Touch Performance
- Human Perception and Latency: Why 10ms Can Matter More Than 100ms
- The Hidden Enemy: Jitter, Inconsistency, and Unstable Touch Input
- Android, iOS, and Game Engines: Software Bottlenecks That Shape Feel
- How Touch Latency Is Measured in the Real World
- Battery Life, Heat, and LTPO Displays: The Cost of Extreme Sampling Rates
- Use-Case Driven Choices: Gaming, Browsing, and Everyday Interaction
- 参考文献
From Pixels to Time: Why Responsiveness Became the New Battlefield
For more than a decade, smartphone progress was measured in pixels. Higher PPI meant sharper text, and OLED redefined contrast and color. Yet, as Steve Jobs once argued with the Retina display, visual realism eventually hits a human limit. Today, the industry has crossed that threshold. **The new battlefield is no longer space, but time**, and responsiveness has become the metric that separates devices that merely look fast from those that feel fast.
This shift is driven by how users interact with modern devices. Scrolling, flicking, dragging, and aiming are not passive visual experiences; they are closed feedback loops between finger, brain, and display. According to human–computer interaction research from institutions such as Microsoft Research, delays under 100 milliseconds may be acceptable for simple UI transitions, but in direct manipulation tasks, humans begin to sense latency at around 10 milliseconds. This is where responsiveness, rather than resolution, defines perceived quality.
At the hardware level, this explains why touch sampling rate has gained strategic importance. While refresh rate governs how often the screen updates, touch sampling rate determines how often the device listens to the user. A higher sampling rate shortens the waiting time before an action is even acknowledged. Engineering analyses show that moving from 60Hz to 240Hz touch input reduces average sensing delay by several milliseconds, a difference that competitive gamers and rhythm game players can consistently perceive.
| Era | Primary Metric | User Impact |
|---|---|---|
| Early 2010s | Pixel density | Sharper text and images |
| Late 2010s | Refresh rate | Smoother motion |
| Mid 2020s | Touch responsiveness | Immediate control feeling |
Concrete use cases make this transition obvious. In fast-paced FPS titles, a few milliseconds can decide whether a shot lands. In Japan’s rhythm game scene, even tiny inconsistencies between tap timing and visual feedback disrupt muscle memory. Reviews by organizations like DXOMARK repeatedly show that devices with similar displays can feel radically different depending on their end-to-end input latency.
Importantly, this does not mean infinite speed always matters. Psychophysical laws such as Weber’s Law suggest diminishing returns at extreme values. However, the industry’s focus on responsiveness marks a philosophical change. **Smartphones are no longer judged only by what they show, but by how faithfully they obey.** This is why time, not pixels, has become the defining arena of modern mobile competition.
What Touch Sampling Rate Really Means and How It Differs from Refresh Rate
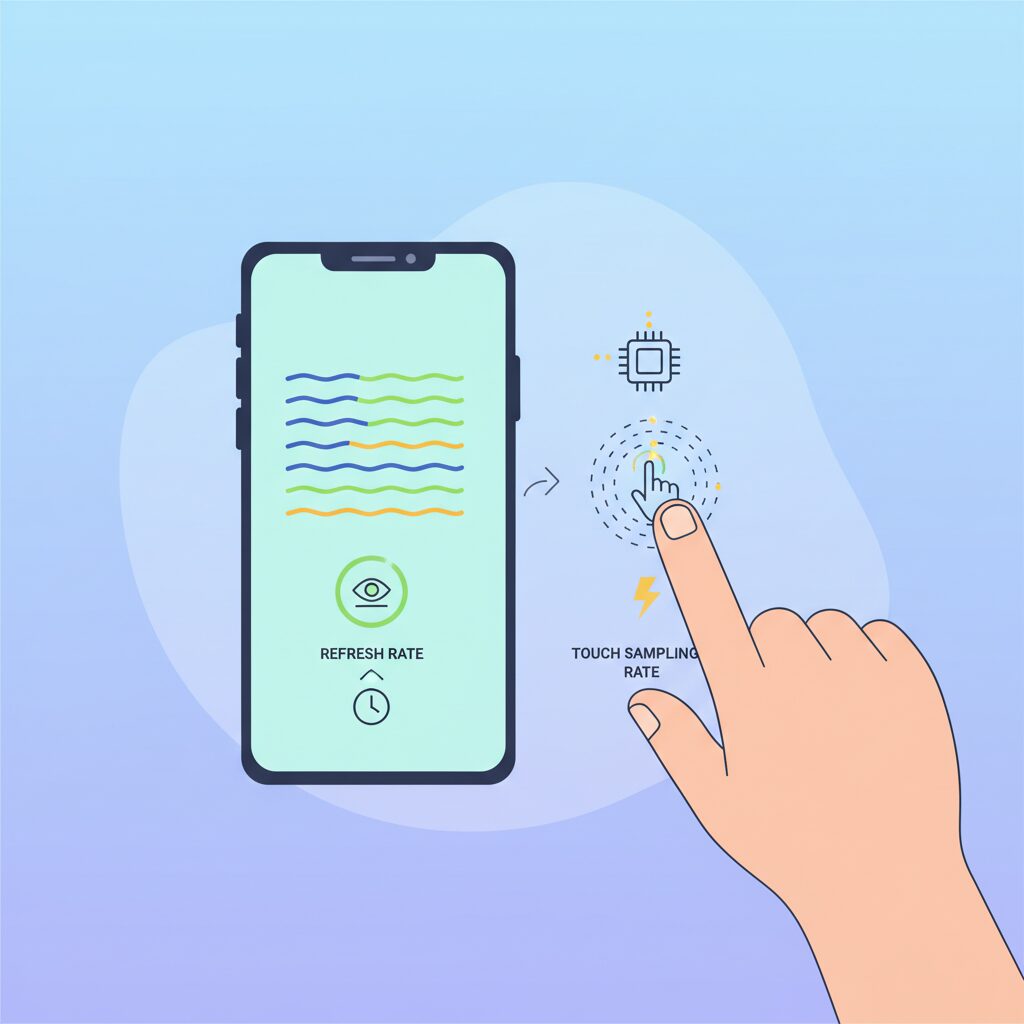
When you read a smartphone spec sheet, touch sampling rate and refresh rate often appear side by side, which can make them feel interchangeable. In reality, they describe two very different moments in time. **Refresh rate governs how often the screen shows something new, while touch sampling rate governs how often the device listens to you.** Understanding this separation is the first step toward making sense of why some devices feel instantly responsive even when their displays look similar on paper.
Refresh rate, expressed in hertz, refers to how frequently the display panel updates its pixels with a new frame generated by the GPU. A 120Hz display redraws the image every 8.33 milliseconds, which directly affects visual smoothness when scrolling or watching animations. Touch sampling rate, by contrast, measures how often the capacitive touch sensor scans for changes in electrical charge caused by your finger. This scanning process converts a physical gesture into digital coordinates that the system can act upon.
This distinction has been repeatedly emphasized by engineers and evaluators at organizations such as DXOMARK, who point out that a screen can look perfectly smooth while still feeling sluggish if input data arrives late or inconsistently. Conversely, a device can detect your finger extremely quickly, yet still feel delayed if the display is slow to present the result. What your brain perceives as “responsiveness” is the alignment between these two timelines.
| Metric | What it measures | Primary impact on experience |
|---|---|---|
| Refresh Rate | How often the display updates frames | Visual smoothness and motion clarity |
| Touch Sampling Rate | How often touch input is scanned | Input latency and control precision |
Modern smartphones rarely keep these two rates in a simple one-to-one relationship. Early devices often ran both at 60Hz, meaning the system checked for touch input once per visual frame. Today, many high-end models use ratios such as 120Hz refresh with 240Hz or higher touch sampling. This approach allows the device to capture more granular finger movement data between frames, reducing the average waiting time before an input is registered.
From a timing perspective, the difference is measurable. At 120Hz touch sampling, the average wait before a finger movement is detected is just over 4 milliseconds. At 240Hz, that drops to about 2 milliseconds, and at 960Hz it approaches half a millisecond. Research discussed in human–computer interaction studies, including work cited by Microsoft Research, shows that in direct manipulation tasks like dragging or aiming, humans can sense discrepancies on the order of 10 milliseconds or less. This explains why higher sampling rates can feel meaningfully tighter, even when the display refresh rate stays the same.
It is also important to understand marketing language here. Some manufacturers advertise extremely high numbers such as 1000Hz or 2000Hz, but these often represent brief burst modes for the initial touch-down event rather than a sustained rate during continuous movement. Analysts from established review labs caution that **the consistency of sampling over time matters more than a single peak figure**, because fluctuating input timing introduces jitter that skilled users notice immediately.
In practical terms, refresh rate determines how smooth the world looks, while touch sampling rate determines how faithfully your intent enters that world. Treating them as separate but cooperative systems helps explain why two phones with the same 120Hz display can feel radically different the moment you start interacting with them.
Inside the Touch-to-Photon Pipeline: Where Every Millisecond Goes
When users talk about responsiveness, they are really describing the touch-to-photon pipeline, the full chain of events between a fingertip and emitted light. **Every millisecond is consumed by a distinct subsystem**, and optimizing one stage while ignoring the rest rarely produces a tangible gain.
The first delay appears at physical sensing. With a 120Hz touch sampling rate, the sensor scans every 8.33ms, meaning an average wait of roughly 4ms before a touch is even detected. Pushing this to 240Hz or 960Hz reduces that waiting window dramatically, a relationship confirmed by teardown analyses from display engineers and measurements reported by DXOMARK.
| Pipeline Stage | Typical Delay | What Dominates |
|---|---|---|
| Touch scan | 0.5–4 ms | Sampling rate, sensor noise |
| OS processing | 5–15 ms | Interrupts, VSYNC sync |
| Rendering + display | 10–25 ms | GPU load, panel response |
After detection, the signal enters processing and transport. The touch controller digitizes the analog capacitance change, filters noise, and raises an interrupt to the SoC. According to Android Open Source Project documentation, this stage is usually short but can spike if aggressive filtering or palm rejection is enabled.
The OS layer is often the silent bottleneck. Android, for example, aligns input dispatch with VSYNC to avoid visual tearing. **This synchronization can add several milliseconds of waiting**, a behavior Google engineers have openly discussed in performance case studies. Apple mitigates this with tighter integration between iOS input threads and Core Animation, which partly explains its consistently low perceived latency.
The final stages involve application logic, GPU rendering, and display scan-out. OLED panels respond in under 0.1ms, so most remaining delay comes from frame rendering and composition. High-speed camera experiments published in academic HCI research repeatedly show that shaving even 5ms here can be more noticeable than doubling touch Hz alone.
Seen end to end, the pipeline explains why headline numbers can mislead. **Responsiveness is a system property**, and only when sensing, software, and display are balanced does the interaction feel truly instantaneous.
Gaming Phones vs Flagships: Different Philosophies of Touch Performance
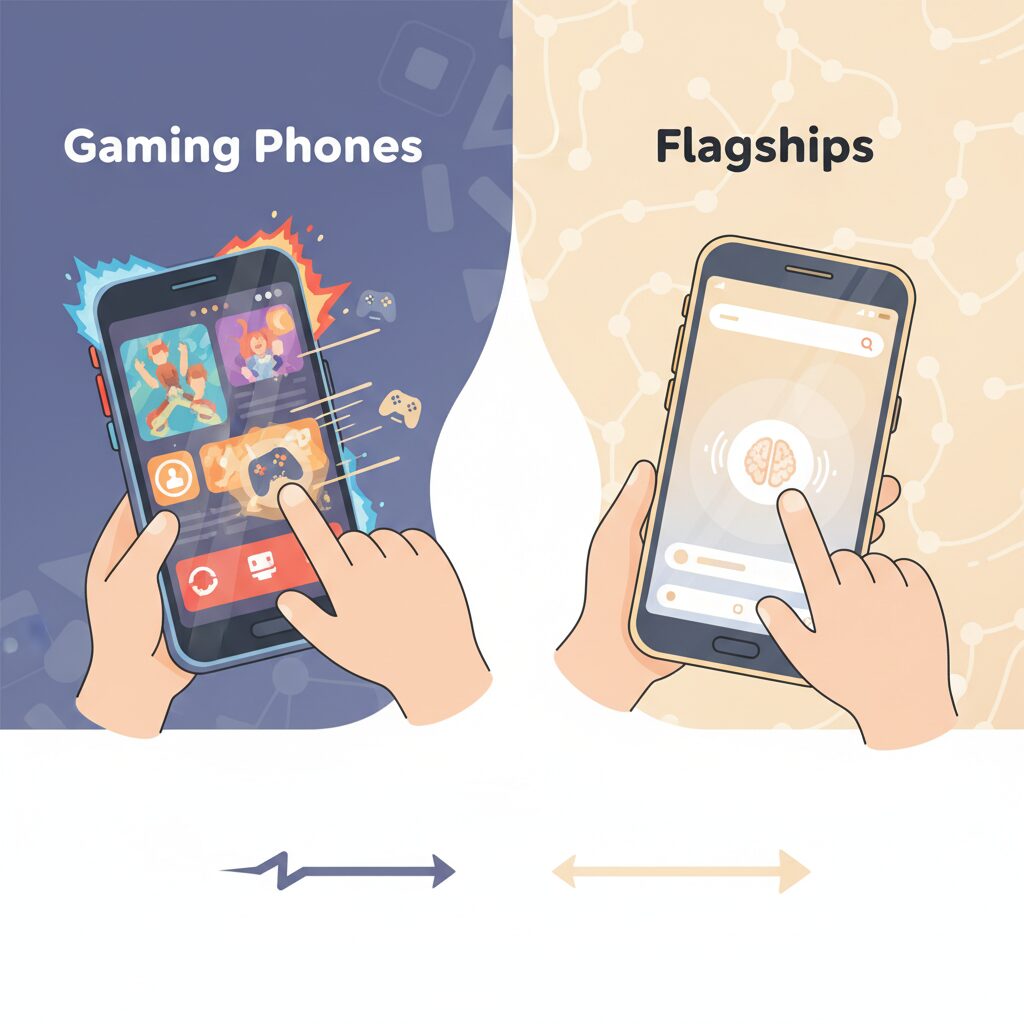
When comparing gaming phones and mainstream flagships, the difference in touch performance is not simply about higher numbers, but about fundamentally different design philosophies. Gaming phones are engineered around the assumption that touch input is a competitive weapon, while flagships treat touch as one element in a broader, everyday experience.
In gaming phones, extremely high touch sampling rates are used to minimize both average latency and jitter. Research discussed by DXOMARK shows that reducing input jitter can be as important as lowering raw delay, because consistency allows the brain to adapt more effectively. This is why devices like RedMagic or ROG Phone emphasize sustained high sampling under load, supported by active cooling and aggressive power budgets.
Flagship smartphones take a more conservative approach. Apple, for example, does not advertise extreme sampling rates, but according to analyses by independent testers and insights aligned with Apple’s UI research tradition, iOS prioritizes touch events at the OS level to ensure smooth perceived responsiveness. This results in a cohesive feel during scrolling and gestures, even if the hardware sampling rate is lower.
| Aspect | Gaming Phones | Flagships |
|---|---|---|
| Touch Strategy | Maximum speed and consistency | System-wide balance |
| Sampling Behavior | Very high, often sustained | Moderate, dynamically managed |
| User Focus | Competitive gaming scenarios | Daily usability and endurance |
According to human-computer interaction studies from institutions such as Microsoft Research, once latency drops below roughly 10 milliseconds in direct manipulation tasks, further gains show diminishing perceptual returns. Flagships are designed around this threshold, while gaming phones intentionally push beyond it for edge-case advantages. Understanding this philosophical split helps readers choose a device based not on marketing figures, but on how touch performance is actually experienced.
Human Perception and Latency: Why 10ms Can Matter More Than 100ms
When discussing input latency, the often-quoted belief that humans cannot perceive delays under 100 milliseconds still appears in many product briefings. However, this idea is increasingly outdated. Modern human–computer interaction research shows that context matters far more than absolute numbers, and in certain interactions, a 10 ms difference can feel dramatically more important than a 100 ms delay elsewhere.
According to research from Microsoft Research and leading HCI laboratories, the 100 ms threshold only applies to simple cause-and-effect actions, such as tapping a button and waiting for a screen transition. In contrast, direct manipulation tasks, where the user’s finger continuously controls an on-screen object, operate under much stricter perceptual limits.
This distinction explains why high touch sampling rates matter most in games and creative tools, but feel irrelevant in basic UI navigation. The human brain constantly compares expected motion with visual feedback, and even tiny mismatches are interpreted as friction or weight.
| Interaction Type | Perceptual Sensitivity | User Experience Impact |
|---|---|---|
| Button tap | ~100 ms | Generally unnoticed if consistent |
| Dragging objects | ~10 ms | Feels heavy or sticky if exceeded |
| Handwriting / inking | 20–50 ms | Visible gap between pen and ink |
Studies on digital inking, including work published by the University of Alberta, demonstrate that users clearly perceive delays as low as 20–30 ms when writing. Even trained users experience reduced accuracy and comfort, because the pen stroke no longer aligns with proprioceptive expectations. This is why stylus-based systems aggressively optimize latency far below traditional UI targets.
The same mechanism applies to mobile gaming. In FPS titles or rhythm games, the finger effectively becomes an analog controller. A 10 ms reduction in touch-to-photon latency directly tightens the feedback loop between intention and result, making aim correction or timing judgments feel more precise.
Another critical factor is consistency. Research into motor control shows that the brain can adapt to a fixed delay through prediction. However, fluctuating latency, often called jitter, breaks this adaptation. A system that alternates between 30 ms and 70 ms feels worse than one locked at a stable 60 ms, even though the average delay is identical.
This insight aligns with findings from both academic literature and professional esports practice. High polling input devices are valued not because humans can consciously detect 1 ms changes, but because dense sampling reduces temporal uncertainty. Each rendered frame is more likely to reflect the most recent finger position.
Finally, psychophysics offers an important warning through Weber’s Law. As latency decreases, the minimum noticeable improvement shrinks proportionally. The jump from 60 Hz to 120 Hz input feels transformative, while moving from 960 Hz to 2000 Hz approaches the edge of human perception. At that point, engineering effort increasingly serves consistency and marketing rather than felt experience.
Understanding why 10 ms can matter more than 100 ms helps separate meaningful responsiveness from empty specifications. It also clarifies why some devices feel instantly connected, even when their headline numbers appear modest.
The Hidden Enemy: Jitter, Inconsistency, and Unstable Touch Input
Even when a device advertises an impressive touch sampling rate, users sometimes feel that something is subtly wrong. This discomfort often comes not from raw latency, but from jitter, inconsistency, and unstable touch input. These hidden enemies quietly undermine the sense of control, especially for gamers and power users who rely on precise, repeatable interactions.
Jitter refers to variability in the timing of touch input delivery. According to Microchip Technology and Cirrus Logic, systems with fluctuating input intervals are far more disruptive than systems with a constant delay. **A stable 50 ms delay can be learned and compensated for by the human brain, but a delay that oscillates between 30 ms and 70 ms cannot be predicted.** This unpredictability breaks the internal timing model formed by the cerebellum, resulting in missed taps, inaccurate swipes, and a persistent feeling that the device is “slippery.”
In modern smartphones, jitter often emerges from the interaction between high touch sampling rates and slower or variable refresh rates. When a 960 Hz touch sensor feeds data into a 60 Hz or LTPO-driven display pipeline, touch events are queued, batched, or dropped depending on OS scheduling. Google’s Android input documentation explains that these batching decisions, while efficient for power saving, can introduce frame-to-frame inconsistency when the system is under load.
| Condition | User Perception | Practical Impact |
|---|---|---|
| Low latency, high jitter | Unstable, unreliable | Missed notes, shaky aim |
| Moderate latency, low jitter | Predictable, controllable | Consistent performance |
DXOMARK’s touch evaluations also emphasize consistency as a scoring factor, noting that devices with slightly higher average latency can outperform faster competitors if their touch response remains uniform over time. **This explains why some flagship phones feel better in rhythm games despite modest specifications on paper.** The stability of touch-to-display timing matters more than peak numbers.
For users, this means that chasing the highest advertised sampling rate does not guarantee better control. What truly defines a premium experience is the absence of surprises. When every tap lands exactly when expected, confidence builds, performance improves, and the device fades into the background. That quiet reliability is the real victory over jitter.
Android, iOS, and Game Engines: Software Bottlenecks That Shape Feel
When users talk about “feel,” they often blame hardware first, but in practice the strongest constraints are imposed by software layers. Android, iOS, and modern game engines decide how much of a high touch sampling rate actually reaches the player’s fingers. Even a 1000Hz panel can feel ordinary if the software pipeline reshapes or delays the input.
On Android, touch events travel from the kernel driver through InputReader and InputDispatcher, then wait for synchronization with VSYNC before an app can consume them. According to the Android Open Source Project documentation and analyses by Google engineers, this design prioritizes consistency and power efficiency, but it can introduce batching behavior. As a result, extremely high-rate touch data may arrive in bursts, subtly increasing jitter under load.
iOS follows a more vertically integrated approach. Apple does not disclose raw sampling numbers, yet studies by DXOMARK and long-running GameBench measurements show that iOS treats touch processing as a high-priority task tightly coupled with Core Animation. This reduces variance rather than chasing headline Hz figures, which explains why many rhythm game players report stable timing even with lower nominal rates.
| Platform Layer | Primary Constraint | Impact on Feel |
|---|---|---|
| Android OS | VSYNC alignment and batching | Potential input jitter under load |
| iOS | Closed, prioritized pipeline | Low variance, consistent response |
| Game Engines | Frame-based polling | Limits benefits of high Hz |
Game engines add another ceiling. Unity’s traditional input model polls once per frame, meaning a 60fps game only checks input 60 times per second. Research shared by Unity engineers shows that newer input systems can capture sub-frame timestamps, but only titles that explicitly implement them benefit. In other words, software choices, not panel specs, ultimately shape what the player feels.
How Touch Latency Is Measured in the Real World
In the real world, touch latency is not something that can be understood by reading a specification sheet alone, and it is measured through a combination of physical experiments and system-level analysis. **What ultimately matters is the time between a human action and visible feedback**, often called end-to-end or touch-to-photon latency, and this is what professional testers focus on.
One of the most widely trusted approaches is high-speed camera testing. In this method, a finger or conductive probe touches the screen while a visual change is triggered at the same moment, and both events are recorded at 1,000 frames per second or more. Researchers at institutions such as Microsoft Research and independent labs like DXOMARK have relied on this technique because it captures the full pipeline, including the touch sensor, OS processing, GPU rendering, and the display’s pixel response.
High-speed camera tests are considered the gold standard because they measure what the user actually sees, not just internal timestamps.
However, camera-based testing is labor-intensive and difficult to standardize. To address this, Google introduced a hardware tool known as WALT, short for Watchdog for Android Latency. WALT uses dedicated sensors connected via USB or audio interfaces to generate precise electrical signals, allowing engineers to measure latency with sub-millisecond accuracy. According to Google’s Android performance team, this method is especially useful for comparing different OS versions or kernel changes under identical conditions.
Another important category is robotic testing, commonly used by review organizations. A robotic arm performs perfectly repeatable taps and swipes, while optical sensors detect when pixels change on the display. DXOMARK applies this technique to score devices on responsiveness and smoothness, which explains why some phones with modest touch sampling rates still rank highly due to stable and predictable latency.
| Measurement Method | What It Captures | Main Strength |
|---|---|---|
| High-speed camera | Full touch-to-photon path | Closest to human perception |
| WALT hardware | Sensor-to-output timing | Extreme precision and repeatability |
| Robotic testing | Touch accuracy and consistency | Objective comparisons at scale |
It is also important to understand what is not measured. Many older benchmark apps only log timestamps inside the OS input stack, which excludes display scan-out and pixel response. Studies published in human-computer interaction journals have shown that these software-only measurements can underestimate real latency by tens of milliseconds, leading to overly optimistic conclusions.
Real-world data from 2024 and 2025 shows that flagship devices typically fall between 30 ms and 80 ms in total touch-to-photon latency. **Differences of just 10 ms can be felt in fast-paced games**, especially when latency fluctuates from frame to frame. This is why experts emphasize consistency over peak numbers when interpreting measurement results.
In practical terms, measuring touch latency is as much about methodology as it is about hardware. When reviewers reference results from high-speed cameras, WALT, or established labs, readers can be confident that the numbers reflect genuine user experience rather than marketing claims. This perspective helps explain why real-world measurements often tell a more nuanced story than headline sampling rates ever could.
Battery Life, Heat, and LTPO Displays: The Cost of Extreme Sampling Rates
Extreme touch sampling rates do not come for free, and the first price users pay is battery life. From an electrical engineering perspective, increasing the sampling rate means driving the capacitive sensor grid more frequently and waking the SoC with a higher interrupt cadence. According to analyses referenced by DXOMARK and GSMArena, even a shift from a conservative 240Hz touch scan to 720–960Hz can measurably raise idle-to-active power draw, because the system struggles to remain in deep sleep states.
In practical terms, the gain of shaving a few milliseconds from input latency often translates into double-digit percentage increases in power consumption during sustained gaming sessions. This is why many manufacturers restrict peak sampling rates to game modes or short bursts, rather than running them continuously.
Thermal behavior is the second, closely related cost. Touch controllers themselves generate heat, but the larger issue is indirect: frequent interrupts keep CPU cores active and prevent efficient thermal equilibrium. Reviews of gaming-oriented devices such as RedMagic and ROG Phone consistently show that aggressive input settings correlate with faster surface temperature rise, unless compensated by vapor chambers or active cooling. GSMArena’s stress tests indicate that once skin temperature exceeds the mid-40s Celsius, thermal throttling becomes unavoidable, undermining the very responsiveness high sampling rates aim to deliver.
This creates a paradox where extreme specifications can reduce real-world consistency if heat is not managed holistically. Gaming phones mitigate this with fans or oversized cooling solutions, while mainstream flagships intentionally avoid pushing touch rates to the limit.
| Touch Strategy | Power Impact | Thermal Risk |
|---|---|---|
| 240Hz fixed | Low to moderate | Minimal |
| 720–960Hz dynamic | Moderate | Noticeable in long sessions |
| 2000Hz burst | High during activation | Short-term spikes |
The introduction of LTPO displays complicates this equation further. LTPO technology dynamically lowers refresh rates to save power, sometimes down to 1–15Hz when the screen is static. From a battery standpoint, this approach is highly effective, and studies cited by display researchers show significant efficiency gains during reading or idle scenarios.
However, the moment a user touches the screen, the system must ramp both refresh rate and touch processing back to high gear. This transition is not instantaneous. As reported by users and analyzed by display engineers, the handoff can introduce a brief latency window measured in tens of milliseconds. For casual use, this is imperceptible, but in rhythm games or competitive scenarios, the first interaction after idle can feel subtly delayed.
Synaptics and other controller manufacturers are actively addressing this gap. Their latest LTPO-aware touch controllers prioritize wake-up responsiveness by decoupling touch scanning from display refresh transitions. According to company briefings, this reduces the initial input penalty without sacrificing the power savings that LTPO enables. Still, independent measurements suggest the trade-off has not been fully eliminated.
The broader lesson is that extreme sampling rates only make sense when aligned with thermal design and display behavior. A balanced system that sustains moderate rates consistently often feels faster than one that advertises eye-catching peaks but throttles under heat or stumbles during LTPO transitions. For users chasing the best experience, understanding this hidden cost is more valuable than any single headline number.
Use-Case Driven Choices: Gaming, Browsing, and Everyday Interaction
Choosing the right touch sampling rate becomes much clearer when it is evaluated through concrete use cases rather than abstract numbers. Gaming, browsing, and everyday interaction each place very different demands on the input pipeline, and understanding these differences helps avoid overpaying for specifications that do not translate into real-world benefits.
In competitive mobile gaming, especially FPS and rhythm titles, **touch sampling rate directly shapes performance and consistency**. High-speed measurements summarized by DXOMARK and GameBench show that devices with elevated sampling rates reduce average touch-to-photon latency and, more importantly, suppress jitter. This stability matters because the human motor system adapts poorly to fluctuating delays. A 960Hz-class panel does not simply feel faster; it feels more predictable during rapid flicks or precise timing windows. For esports-oriented players, this predictability often outweighs raw peak values advertised in marketing materials.
| Use Case | Typical Interaction Pattern | Effective Sampling Priority |
|---|---|---|
| Competitive Gaming | Rapid taps, micro-swipes, continuous tracking | High and stable (720–960Hz) |
| Web Browsing | Scrolling, pinch-zoom, short taps | Moderate (240Hz class) |
| Everyday UI | Navigation, typing, casual gestures | Consistency over peak speed |
For web browsing and content consumption, the equation changes noticeably. Scroll responsiveness is influenced by touch sampling rate, but only up to a point. Research from Microsoft Research on direct manipulation interfaces suggests that once end-to-end latency drops below roughly 10–15ms, perceived gains diminish rapidly. On modern 120Hz smartphones with around 240Hz touch sampling, inertia scrolling already feels tightly coupled to finger movement. Pushing beyond this range rarely improves reading or navigation comfort, while it can increase battery drain.
Everyday interaction such as typing, app switching, or UI navigation benefits least from extreme specifications. Here, **software prioritization and palm-rejection algorithms dominate the experience**. Apple’s iOS input stack, for example, is often cited by HCI researchers for assigning touch handling to high-priority threads, which explains why devices with modest sampling rates still feel fluid. In these scenarios, a well-tuned 240Hz system can outperform a poorly optimized 1000Hz implementation.
Ultimately, a use-case driven choice prevents specification fatigue. Gamers gain tangible advantages from high and stable sampling rates supported by thermal headroom and software tuning. Browsing-focused users achieve near-optimal comfort at far lower levels. For daily interaction, responsiveness is less about raw Hz and more about how intelligently the device manages touch events across the entire system.
参考文献
- RedMagic Official Blog:How Touch Sampling and Screen Refresh Rates Shape Your Gaming Experience
- MakeUseOf:Touch Sampling Rate vs. Refresh Rate: What’s the Difference?
- DXOMARK:The Importance of Touch-to-Display Response Time in Gaming
- Google Android Open Source Project:Input Overview
- Unity Technologies:Unity Input System Manual
- Synaptics:Rio Touch Controller Enables Power-Efficient LTPO Display Panels