Flagship smartphones now cost well over $1,000 in many markets, and in some regions they exceed $1,300–$1,500. As prices continue to climb due to currency fluctuations, semiconductor costs, and supply chain shifts, upgrading your phone is no longer a simple purchase decision. It is a financial strategy.
At the same time, the global secondhand smartphone market is expanding steadily, with millions of devices changing hands every year and refurbished models gaining mainstream acceptance. More consumers are treating their smartphones not as disposable gadgets, but as liquid assets with measurable resale value.
In this guide, you will learn how to protect and maximize your smartphone’s resale value in 2026. From model selection and battery health management to grading systems, carrier trade-in programs, and resale channel optimization, you will discover practical, evidence-based strategies that can save—or even earn—you hundreds of dollars over a typical upgrade cycle.
- The Shift from Gadget Ownership to Asset Management in the Smartphone Era
- Why the Global Refurbished Smartphone Market Is Booming
- iPhone vs. Android: Long-Term Resale Value Gap Explained with Market Data
- The 3–4 Year Sweet Spot: When to Sell for Maximum Return
- Inside the Grading System: How Buyback Companies Calculate Your Phone’s Value
- Display Condition as a Price Trigger: Why One Scratch Can Cost You Hundreds
- Battery Health and the Critical 80% Threshold: The Hidden Depreciation Line
- Invisible Damage: Liquid Contact Indicators and Internal Risk Factors
- Resale Channels Compared: Trade-In Programs vs. Buyback Stores vs. Peer-to-Peer Marketplaces
- Real Profit Simulation: Net Payout Comparison After Fees, Points, and Risk
- Battery Longevity Science: Charging Habits That Preserve Long-Term Value
- Secure Data Erasure: Factory Reset, Encryption, and NIST-Compliant Wiping
- Carrier Upgrade Programs as Financial Instruments: Residual Value and Risk Transfer
- Timing the Market: When Seasonal Demand and Product Launch Cycles Boost Prices
- 参考文献
The Shift from Gadget Ownership to Asset Management in the Smartphone Era
In the mid-2020s, smartphones are no longer treated as simple consumer gadgets. They are increasingly managed as liquid assets. As flagship models regularly exceed 200,000 yen in Japan, purchasing decisions are now influenced not only by features and performance, but by expected resale value and exit timing.
According to MM Research Institute, used smartphone sales in Japan reached 3.53 million units in fiscal 2025, marking a 9.8% year-on-year increase. This is not merely a sign of frugality. It reflects the maturation of an ecosystem where devices circulate strategically, and ownership is evaluated through the lens of return on investment.
The key shift is psychological: consumers are moving from “How much does this cost?” to “How much will this retain?”
This mindset aligns with broader macroeconomic realities. Prolonged yen depreciation, rising semiconductor costs, and supply chain restructuring have structurally elevated retail prices. When entry costs rise, asset awareness naturally follows. A smartphone purchased today is implicitly assessed against its projected resale price three years later.
The growing share of certified pre-owned devices further supports this transition. Carrier-backed “Certified” programs reduce perceived risk and legitimize the secondary market. As ITmedia reports, used devices are projected to account for more than 10% of total smartphone shipments in Japan by 2026. Liquidity reinforces asset behavior.
| Ownership Model | Primary Focus | Consumer Mindset |
|---|---|---|
| Traditional Purchase | Upfront price & features | Consumption |
| Asset-Oriented Purchase | Depreciation & resale timing | Capital efficiency |
Brand dynamics illustrate this clearly. In 2025 used-device transaction rankings, iPhone models accounted for roughly 70% of distribution value, with models such as iPhone 13 and 14 dominating circulation. Their relatively stable residual value turns them into predictable financial instruments compared with many Android counterparts.
Corporate demand also strengthens this asset framework. As companies accelerate digital transformation, bulk procurement of cost-efficient used smartphones has expanded. Institutional buyers increase market depth and price stability, characteristics typically associated with mature asset classes.
Inbound demand adds another layer. A weaker yen has encouraged foreign visitors to purchase high-quality Japanese used iPhones, particularly SIM-free models. This cross-border arbitrage effect provides additional price support and reinforces the perception of smartphones as globally tradable goods.
The smartphone lifecycle is therefore no longer linear (buy → use → discard). It is circular (acquire → preserve → liquidate → reallocate capital). Ownership duration becomes a strategic variable, not an afterthought.
For gadget enthusiasts, this shift does not diminish passion for technology. Instead, it reframes it. Spec comparisons coexist with depreciation curves. Launch events are evaluated alongside resale timing. In this era, mastering technology also means mastering its financial trajectory.
The smartphone has evolved into a hybrid entity: part communication device, part financial asset. Understanding this transformation is the first step toward navigating the modern gadget economy with precision and intent.
Why the Global Refurbished Smartphone Market Is Booming
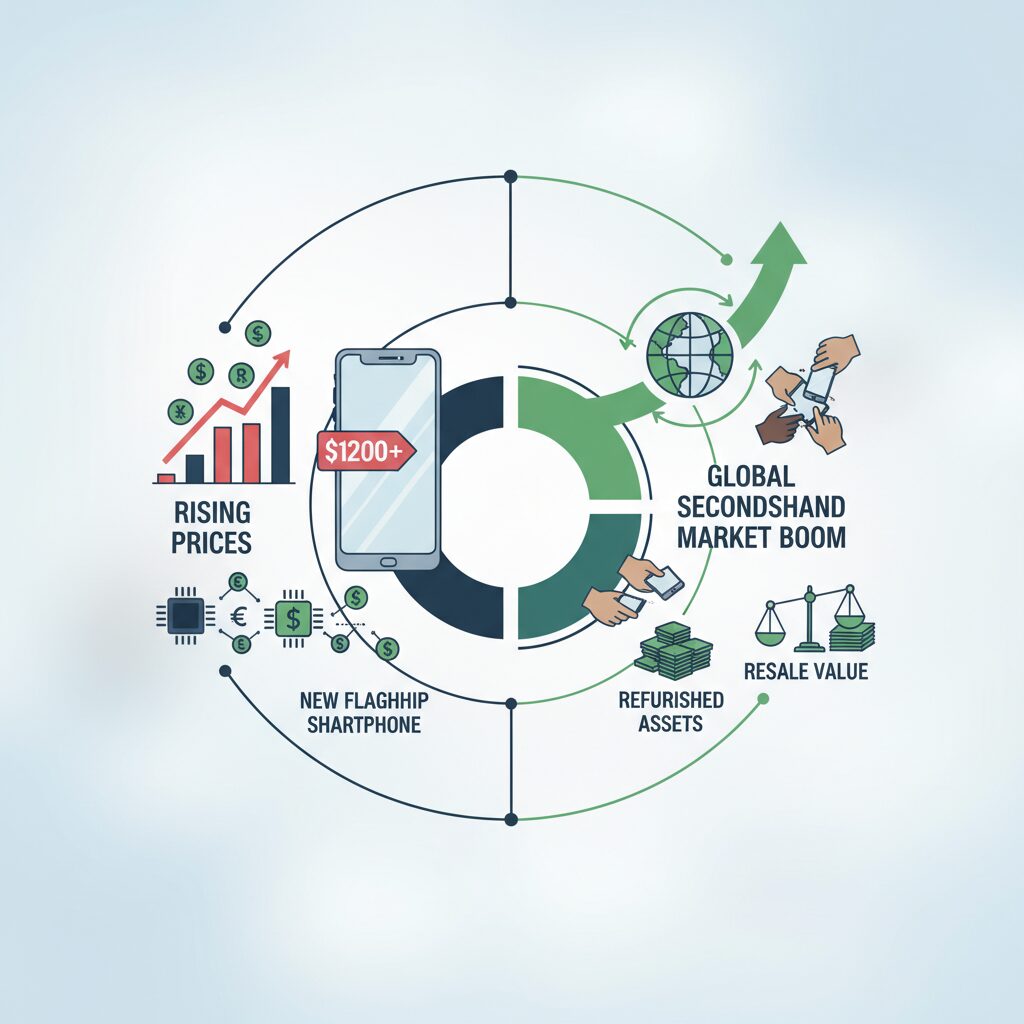
The global refurbished smartphone market is expanding at an unprecedented pace, driven not by short-term frugality but by a structural shift in how consumers perceive device ownership. As flagship models increasingly exceed premium price thresholds, buyers are no longer treating smartphones as disposable gadgets. They are treating them as financial assets with residual value.
In Japan, MM Research Institute reports that used smartphone sales reached 3.53 million units in fiscal 2025, up 9.8% year over year. This sustained multi-year growth reflects a mature resale ecosystem rather than temporary demand. Similar dynamics are visible globally, where resale channels, certified programs, and trade-in schemes reinforce circular device flows.
The core driver is a shift from “ownership for consumption” to “ownership for asset optimization.”
Several structural forces explain this acceleration.
First, rising new-device prices are reshaping demand curves. Currency depreciation, semiconductor cost increases, and supply-chain realignment have pushed high-end smartphone prices higher. When new flagships cross psychologically significant price levels, high-quality refurbished models become economically rational substitutes rather than compromises.
Second, quality assurance mechanisms have reduced perceived risk. Carrier-certified refurbished devices and professional grading standards have narrowed the trust gap. Clear ranking systems and battery health disclosures provide transparency, making refurbished purchases predictable rather than speculative.
Third, resale value stability—particularly for iPhone models—creates liquidity confidence. According to ITmedia Mobile’s circulation data, iPhones account for roughly 70% of used smartphone transaction value in Japan during 2025. This dominance signals strong secondary-market depth, which in turn reassures primary buyers that exit opportunities will remain available.
| Growth Driver | Market Impact | Consumer Effect |
|---|---|---|
| Rising flagship prices | Increased refurbished demand | Value-seeking upgrades |
| Certified programs | Lower transaction risk | Higher purchase confidence |
| Strong resale liquidity | Stable secondary pricing | Asset-like ownership mindset |
Corporate demand is another underappreciated catalyst. As enterprises accelerate digital transformation, cost-efficient bulk procurement of reliable devices becomes essential. Refurbished smartphones offer predictable performance at lower capital expenditure, increasing institutional participation in the secondary market and improving overall price stability.
Inbound tourism has also contributed in certain regions. Favorable currency conditions have encouraged international buyers to purchase high-quality used devices, especially SIM-free iPhones, reinforcing secondary-market pricing floors.
Finally, sustainability considerations are influencing purchasing decisions. Extending device lifecycles aligns with ESG priorities for both corporations and consumers. Refurbished adoption reduces electronic waste and embedded carbon intensity per user-year, strengthening the ethical case alongside the financial one.
When high upfront prices, transparent grading, institutional demand, cross-border liquidity, and sustainability incentives converge, the result is powerful momentum. The refurbished smartphone market is not booming because devices are old—it is booming because value is now measurable, tradable, and strategically managed.
iPhone vs. Android: Long-Term Resale Value Gap Explained with Market Data
When you look at long-term resale value, the gap between iPhone and Android is not just anecdotal. It is clearly visible in hard market data from Japan’s rapidly expanding secondary smartphone market.
According to MM Research Institute, used smartphone sales reached 3.53 million units in FY2025, up 9.8% year over year. Within that growing pie, iPhone accounts for roughly 70% of total used-device transaction value, as reported by ITmedia Mobile based on 2025 first-half circulation rankings.
This dominance directly translates into stronger and more stable resale pricing over time.
| Metric (Japan, 2025) | iPhone | Android |
|---|---|---|
| Share of used market value | Approx. 70% | Approx. 30% |
| 3–4 year-old model liquidity | High (e.g., iPhone 12/13) | Limited, model-dependent |
| Typical price stability | Gradual decline | Faster depreciation |
One striking example is how older iPhones continue to rank in both sales and buyback charts. GEO’s 2025 rankings show models such as iPhone 12 and 13 dominating circulation, and even much older devices like iPhone 8 still appearing in transaction data. This indicates sustained demand well beyond the initial two-year carrier cycle.
By contrast, Android resale performance tends to be highly fragmented. While certain models like Google Pixel 8a perform relatively well, resale strength is usually model-specific rather than ecosystem-wide. The depreciation curve is steeper, especially after the first two years.
The key difference lies in liquidity. iPhones benefit from broad consumer demand, corporate procurement needs, and inbound tourism purchases driven by the weak yen. This multi-layered demand base supports price floors in the secondary market.
Another important factor is the “3–4 year sweet spot.” Market data shows that devices released three to four years ago often hit the optimal balance between affordability and performance. For sellers, this means that a three-year holding period can significantly reduce total cost of ownership when resale is factored in.
For example, a flagship iPhone purchased at a premium price may still command a meaningful resale value after three years, cushioning the effective ownership cost. Many Android flagships, however, experience sharper value compression once newer chip generations and design changes arrive.
This is not merely about brand perception. It reflects structural differences in software update longevity, second-hand buyer confidence, and global standardization of models.
Carrier residual-value programs further highlight this divergence. Because iPhones tend to retain higher market prices after two years, users who purchase outright and resell strategically may outperform fixed residual programs. With many Android devices, however, faster depreciation increases the attractiveness of transferring residual risk back to the carrier.
Ultimately, the long-term resale value gap is not a matter of opinion. It is supported by transaction volume, market share in circulation value, and observed depreciation patterns across multiple years.
For gadget enthusiasts who upgrade frequently, understanding this data-driven gap is essential. The device you choose today directly shapes how much capital you can recover three years from now.
The 3–4 Year Sweet Spot: When to Sell for Maximum Return
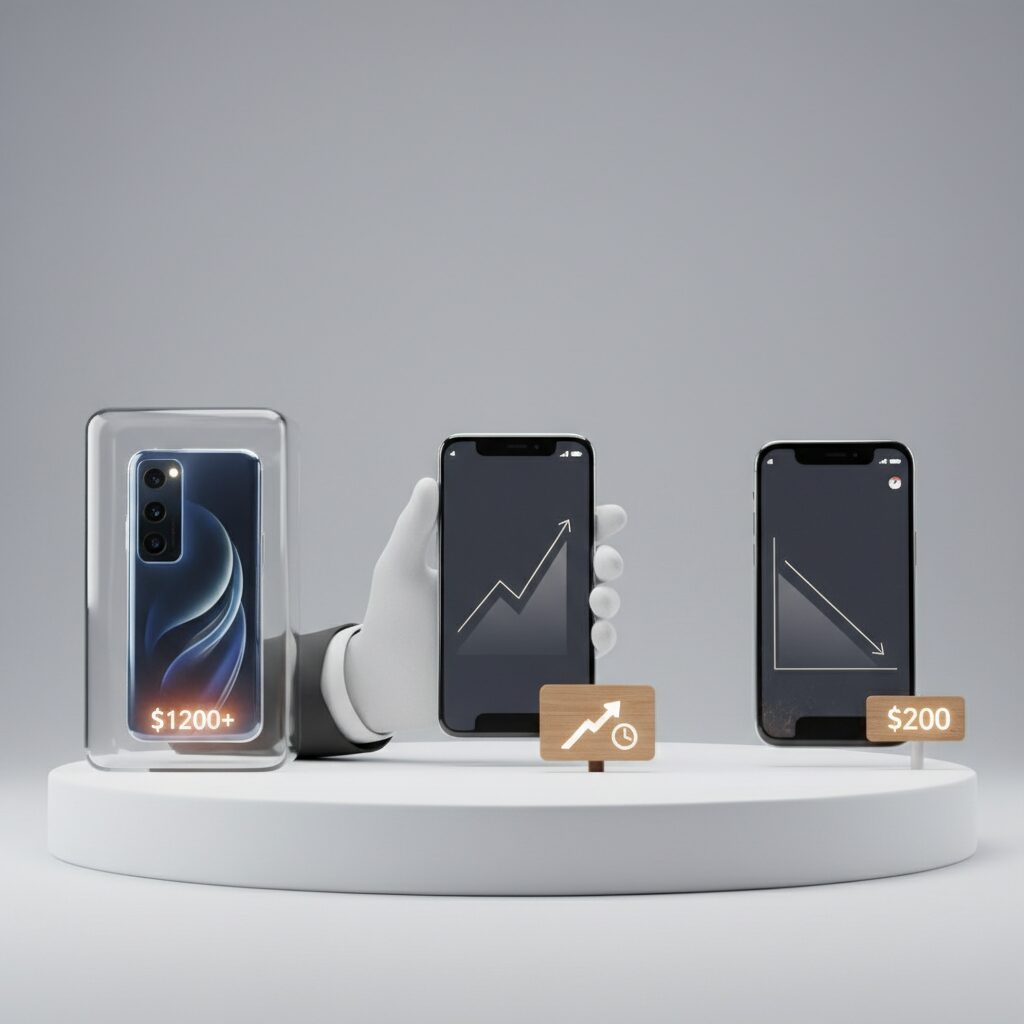
In Japan’s rapidly expanding secondary smartphone market, the most profitable exit timing is not random. It clusters around a clear window: three to four years after release. Market data from MM Research Institute shows used smartphone sales reaching 3.53 million units in FY2025, up 9.8% year over year, indicating strong liquidity precisely for devices in this age band.
The reason is structural. After three years, flagship models still run current apps smoothly, receive security updates, and maintain battery health above critical thresholds in many cases. At the same time, their prices fall into a range accessible to value-oriented buyers, corporate bulk purchasers, and inbound demand seeking reliable Japanese-spec iPhones.
The 3–4 year window balances two curves: performance depreciation slows, while price depreciation has already accelerated. This creates maximum resale efficiency for the original owner.
According to Geo’s 2025 used smartphone rankings, models such as iPhone 12 and iPhone 13 dominate both sales and buyback lists, even several years after launch. Older devices like iPhone 8 still appear in circulation, proving continued demand—but their resale ratios are significantly lower compared to devices in the 3–4 year band.
| Age Since Release | Market Demand | Resale Efficiency |
|---|---|---|
| 0–2 Years | High | Depreciation still steep |
| 3–4 Years | Very High | Optimal balance |
| 5+ Years | Moderate | Sharp value drop |
From an asset management perspective, selling too early means absorbing the steepest depreciation curve. Flagship smartphones exceeding ¥200,000 in 2026 pricing often lose a significant portion of value within the first 24 months. However, by year three, depreciation flattens. You are no longer competing with brand-new inventory alone, but serving a different buyer segment.
Battery health also plays a decisive role. Apple defines 80% maximum capacity as the service threshold. Many users reach 82–85% around the three-year mark under moderate usage. Selling before crossing the 80% line avoids severe grading penalties in professional buyback channels.
There is also a psychological factor. Three-year-old devices feel “proven” rather than outdated. Corporate buyers deploying devices for field operations prioritize stability over novelty. Inbound shoppers often seek SIM-free Japanese iPhones known for good condition standards. This sustained cross-segment demand stabilizes pricing.
Waiting beyond four years increases risk. Software support cycles shorten effective lifespan perception. Cosmetic wear accumulates. Replacement parts like batteries or displays may be required to maintain grade A or B status, eroding margin.
The strategic cycle becomes clear: purchase carefully, maintain condition rigorously, and exit between year three and four before technical thresholds and perception shifts reduce liquidity.
In a market where smartphones are increasingly treated as circulating assets rather than disposable goods, timing is not guesswork. It is a disciplined, data-backed decision aligned with depreciation physics and secondary market demand dynamics.
Inside the Grading System: How Buyback Companies Calculate Your Phone’s Value
When you submit your phone for a quote, the price you receive is not arbitrary. Buyback companies apply a structured grading system based on measurable risk and resale potential. Understanding this logic allows you to predict the outcome before handing over your device.
Grading is essentially a risk-adjusted resale forecast. The higher the certainty that a device can be resold quickly at market price, the closer it stays to the maximum quote.
Core Evaluation Criteria
| Category | What Inspectors Check | Impact on Value |
|---|---|---|
| Exterior Condition | Scratches, dents, paint wear | Rank shifts (A → B → C) |
| Display Quality | Visible scratches, burn-in, cracks | Major downgrade risk |
| Battery Health | Maximum capacity percentage | Sharp drop below 80% |
| Functional Integrity | Camera, Face ID, buttons, speakers | Failure may trigger junk status |
Major operators such as Iosys and Geo publicly describe rank-based systems in which devices are categorized from near-new to heavily damaged. According to disclosed criteria, even minor cosmetic flaws can shift a device from Rank A to Rank B, often reducing payout by 10–20%.
The display carries disproportionate weight. Because it directly affects user experience and resale appeal, a small scratch on the screen can cause a full rank downgrade, even if the frame is pristine. Inspectors typically examine the screen under bright light to detect hairline marks invisible in casual viewing.
Battery health is another quantitative trigger. Apple defines 80% maximum capacity as the threshold for recommended replacement, and this benchmark has become a de facto pricing line in the secondary market. Devices above 80% usually avoid major penalties, while those below it may face steep reductions or be classified as lower grade.
This is not about punishment; it reflects refurbishment cost. If the reseller expects to replace a battery, that projected expense is embedded into your quote.
Internal indicators also matter. Liquid Contact Indicators inside SIM trays are checked during inspection. Even if the device functions normally, a triggered water indicator increases long-term failure risk and can move the phone into a non-standard or junk category.
Finally, grading consistency is reinforced by process standardization. Large buyback companies often use professional diagnostic tools and certified data-erasure systems to verify functionality before finalizing the grade. This reduces subjective judgment and ties pricing to operational cost models rather than negotiation.
If you understand how each variable translates into financial adjustment, you can estimate your device’s likely rank in advance. That insight turns the grading system from a black box into a predictable value equation.
Display Condition as a Price Trigger: Why One Scratch Can Cost You Hundreds
In the resale market, display condition functions as a direct price trigger. Even a single visible scratch can immediately shift your device into a lower grading tier, and that shift often translates into a loss worth hundreds of dollars.
Major Japanese buyback operators such as Iosys clearly state in their grading criteria that higher ranks require a scratch-free display. While minor frame wear may be tolerated, the screen is judged under far stricter standards because it directly affects user experience.
A flawless display preserves optionality. A scratched display limits your exit strategy. That difference becomes painfully clear at the moment of appraisal.
| Display Condition | Typical Grade Impact | Price Effect |
|---|---|---|
| No visible scratches | Rank A or higher | Near maximum reference price |
| Hairline scratches (visible under light) | Rank B | 10–20% reduction |
| Clearly visible scratch | Rank C | 20–40% reduction |
| Crack or chip | Junk category | 50%+ reduction or fixed low price |
The economic logic is simple. According to resale pricing tables published by Iosys, flagship models such as the iPhone 14 still command strong secondary-market value when graded A or above. However, once downgraded to Rank C, the reference price can drop dramatically compared to the top tier.
That downgrade is often triggered by something as small as a 2–3 mm line scratch. Professional buyers inspect displays under angled lighting specifically to detect these marks.
Why is the screen treated so harshly compared to the frame? Because cosmetic body damage can be hidden with a case, but display damage is impossible to ignore during daily use. From a buyer’s perspective, screen imperfections reduce perceived quality every time the device is unlocked.
This perception gap directly affects liquidity. Devices with perfect displays sell faster and require less price negotiation. In contrast, listings that mention “minor screen scratches” tend to invite discount demands, particularly on peer-to-peer platforms like Mercari where buyers are highly condition-sensitive.
The market does not price scratches emotionally. It prices them algorithmically through grade conversion. One grade drop compounds into lower demand, lower bargaining power, and fewer channel options.
Even carrier trade-in programs, which are generally more forgiving than specialty shops, separate “good condition” from “damaged” categories. Once a crack is detected, fixed lower payout tiers apply regardless of overall functionality.
From an asset-management perspective, the display is not merely a component. It is the primary valuation anchor. Protecting it from day one with a high-quality tempered glass protector costs a fraction of the potential resale loss.
When flagship prices routinely exceed ¥200,000 in Japan’s 2025–2026 market environment, preserving display integrity becomes a financial decision rather than a cosmetic one. A single moment of unprotected impact can erase months of retained value.
In practical terms, treating the display as your device’s balance sheet is the most rational approach. Because in the resale economy, one scratch is rarely just a scratch. It is a price trigger.
Battery Health and the Critical 80% Threshold: The Hidden Depreciation Line
In the resale market, battery health is not just a technical metric but a financial trigger. Among all numeric indicators visible in the settings menu, none influences depreciation as sharply as the maximum battery capacity percentage.
Apple officially recommends battery replacement when maximum capacity drops to 80%, and this figure has effectively become the market’s invisible red line. The moment a device falls below 80%, its asset classification changes.
Major Japanese buyback services, including those referenced by Sofmap’s Rakuru guide, clearly state that devices under 80% may face substantial deductions. This is not symbolic; it is structural pricing logic.
| Battery Health | Market Perception | Pricing Impact |
|---|---|---|
| 90–100% | Excellent condition | Full or near-full valuation |
| 85–89% | Normal aging | Minor or no deduction |
| 80–84% | Borderline zone | Buyer caution increases |
| Below 80% | Replacement recommended | 20–70% deduction possible |
Why is 80% so critical? Because below this threshold, iOS may display a battery degradation warning. Once that message appears, buyers and resellers interpret the device as requiring imminent maintenance.
This immediately converts a “used but healthy” phone into a “cost-bearing asset.” Even if the device performs normally, the expectation of battery replacement cost becomes embedded in the resale price.
In practical terms, 81% and 79% are worlds apart in valuation psychology.
From an economic standpoint, this creates a timing strategy. If your battery health declines from 85% to 82%, resale value may remain largely intact. But waiting until it drops to 79% can trigger steep depreciation overnight.
Market data and buyback policies show that deductions below 80% are not linear. They are step-based. Crossing the threshold often shifts the device into a lower internal grade.
This step change explains why strategic sellers monitor battery health monthly once it approaches the low 80s.
There is also a behavioral dimension. According to Apple’s lithium-ion battery documentation, battery aging is chemically irreversible and influenced by charge cycles and heat exposure. Buyers understand this.
When they see 78%, they do not just see reduced capacity. They see heavier prior usage and potentially accelerated aging patterns.
Battery health functions as a usage transparency index.
Some sellers consider replacing the battery before resale. However, unless performed through authorized service with verifiable parts pairing, replacement does not always restore full resale confidence.
In certain cases, third-party replacements may even lower buyer trust if system messages indicate non-genuine components.
This makes proactive management more profitable than reactive repair.
The optimal exit window often lies between 82% and 85%. At this range, buyers perceive normal wear, no warning appears, and pricing remains within higher grading tiers.
Waiting for “just a little longer” usage may feel rational, but financially it compresses your residual value curve.
The 80% line is not a technical suggestion. It is the hidden depreciation boundary that separates controlled asset rotation from forced discounting.
Invisible Damage: Liquid Contact Indicators and Internal Risk Factors
Even when a smartphone looks flawless on the outside, hidden internal damage can instantly collapse its resale value. In professional grading standards used by major buyers such as Iosys and Geo, devices with internal water exposure are often classified as junk, regardless of current functionality. This gap between appearance and internal condition is where many sellers lose tens of thousands of yen without realizing it.
The most critical invisible factor is the Liquid Contact Indicator (LCI). Apple places LCIs inside the SIM tray area on iPhones. Under normal conditions, the indicator remains white or silver. When exposed to liquid, it turns red. According to repair industry guidance, once the LCI is triggered, the device is considered to have experienced liquid contact even if it powers on normally.
| Indicator State | Internal Condition Risk | Resale Impact |
|---|---|---|
| White / Silver | No detected liquid exposure | Standard grading applies |
| Red | Corrosion risk inside device | Often classified as junk or heavily discounted |
Why is the market so strict about this tiny sensor? Because liquid damage is not a one-time event. Moisture can trigger long-term corrosion on the logic board, battery connectors, and Face ID or camera modules. Experts in smartphone repair frequently report that corrosion may appear weeks or months after exposure, leading to sudden failure. From a buyer’s perspective, that future risk must already be priced in.
Water resistance ratings do not guarantee asset protection. Even devices marketed as water-resistant can still trigger the LCI if exposed to high-pressure water, steam, or prolonged humidity. Using a phone in a bathroom, near a kitchen sink, or during heavy rain can be enough under certain conditions. Overconfidence in IP ratings often results in unexpected resale penalties.
Internal risk factors extend beyond obvious submersion. Condensation caused by rapid temperature changes can introduce microscopic moisture inside the chassis. For example, moving from a cold outdoor environment into a warm, humid room can create internal condensation. This kind of exposure may not cause immediate malfunction, but it increases oxidation risk over time.
Professional buyers physically inspect the SIM slot with a light to verify the LCI status during assessment. This process takes seconds, yet its impact on pricing is enormous. In many cases, an otherwise rank A device instantly drops to the lowest tier once liquid exposure is confirmed.
From an asset management perspective, preventing invisible damage requires behavioral discipline. Avoid exposing the device to humid environments, refrain from charging in steamy rooms, and never assume that “water-resistant” means “waterproof.” These habits may seem minor, but in a market where resale values for flagship models can exceed 50,000 yen, internal integrity directly translates into financial outcomes.
Ultimately, resale valuation is not based solely on cosmetic perfection. It is a risk assessment exercise. Liquid Contact Indicators and internal corrosion risks represent hidden liabilities, and the secondary market prices them accordingly. Protecting your smartphone’s invisible components is therefore just as critical as preventing scratches on the display.
Resale Channels Compared: Trade-In Programs vs. Buyback Stores vs. Peer-to-Peer Marketplaces
Choosing the right resale channel directly affects your final return. Even with the same device and condition, the gap between options can reach tens of thousands of yen equivalent in value. According to MM Research Institute, Japan’s used smartphone market reached 3.53 million units in FY2025, up 9.8% year over year, which means liquidity is high—but pricing power depends on where you sell.
The key difference is not just price, but risk allocation, convenience, and form of compensation. Below is a structural comparison of the three major channels.
| Channel | Pricing Logic | Payout Form | Risk & Effort |
|---|---|---|---|
| Carrier Trade-In | Fixed tiers, campaign-driven bonuses | Points or bill credits | Low risk, minimal effort |
| Buyback Stores | Market-linked grading (S–C, Junk) | Cash (often same day) | Moderate; strict inspection |
| Peer-to-Peer Marketplaces | Open market pricing | Cash after fees | High; disputes, shipping, delays |
Carrier trade-in programs function as a risk hedge. As reported by K-Tai Watch, NTT Docomo has offered temporary trade-in bonuses of up to 17,000 yen for models like the iPhone 14. These campaigns can override normal market logic. Even devices with visible scratches or cracked screens may qualify under broad categories, reducing the penalty that specialist graders would impose.
However, compensation is often issued as d points, Ponta points, or bill credits rather than cash. If you do not fully utilize the ecosystem, the effective value declines. Trade-in works best when you prioritize frictionless upgrading over maximum liquidity.
Buyback stores such as Iosys or GEO operate on dynamic pricing. According to Iosys’ published price lists, an iPhone 14 128GB in good condition has been valued around 51,000 yen at peak periods. The advantage is immediate cash and professional data erasure processes, sometimes using certified tools. The drawback is strict grading: even minor display scratches can push a device from Rank A to B or lower, materially reducing payout.
Peer-to-peer marketplaces like Mercari show listing prices for iPhone 14 128GB frequently in the 50,000–60,000 yen range. On paper, this is the highest ceiling. In practice, a 10% platform fee plus shipping narrows the gap. A 58,000 yen sale may result in roughly 51,000 yen net before accounting for time and dispute risk.
Strategically, your decision should reflect device condition, urgency of cash, and tolerance for friction. Resale channel optimization is not about chasing the highest headline price—it is about maximizing realized, risk-adjusted return.
Real Profit Simulation: Net Payout Comparison After Fees, Points, and Risk
To understand which exit strategy truly maximizes your return, we need to move beyond headline prices and calculate the real net payout after fees, points, depreciation risk, and condition-based deductions.
In Japan’s expanding secondary market, where MM Research Institute reports 3.53 million used smartphones sold in FY2025, price transparency has improved. However, the gross figure shown on a website rarely equals what actually ends up in your pocket.
The key is not the highest listed price, but the most predictable and defensible net outcome.
| Channel | Gross Offer | Net Payout (Estimated) | Main Risk Factor |
|---|---|---|---|
| Specialty Shop (Rank A) | ¥51,000 | ¥51,000 | Condition downgrade |
| Mercari | ¥58,000 | ¥51,200 | 10% fee + shipping + disputes |
| Carrier Trade-in (Campaign) | ¥53,000 equivalent | ¥53,000 in points | Point liquidity constraint |
Using iPhone 14 128GB (Rank B condition) as a case model based on IOSYS pricing data and Mercari transaction ranges, the apparent Mercari advantage nearly disappears after subtracting a 10% platform fee and approximately ¥1,000 shipping cost.
Moreover, consumer protection rules on marketplaces mean that even minor battery complaints can trigger refund negotiations. That time and stress cost is not reflected in the price tag.
Carrier trade-ins, such as docomo’s limited-time ¥17,000 bonus campaigns reported by Impress Watch, can temporarily distort the market. When these campaigns are active, the effective payout may exceed specialty store cash offers.
However, liquidity matters. Points are not cash. If converted inefficiently or left unused, their real economic value declines. From a financial perspective, this is a discount factor problem.
Risk-adjusted value often favors stability over theoretical maximums.
Condition volatility is another hidden variable. According to IOSYS grading criteria, a single visible display scratch can shift a device from Rank A to Rank C, potentially reducing value by over ¥10,000. That downside risk must be incorporated into any projection.
Battery health adds a nonlinear risk. Crossing below the 80% threshold—aligned with Apple’s replacement guidance—can trigger 20–70% reductions in some channels. Selling at 82% versus 79% can materially change ROI.
When modeling total ownership cost over three years, the equation becomes clearer:
Net Cost = Purchase Price − Final Net Payout − Campaign Benefits
If a ¥200,000 flagship retains ¥53,000 after three years, the effective usage cost is ¥147,000. If poor condition drops payout to ¥40,000, real cost rises to ¥160,000. That ¥13,000 difference equals months of service fees.
The conclusion from simulation is practical: pristine iPhones with controlled battery health favor specialty resale; lightly worn units during campaign windows favor carrier trade-ins; high-effort sellers may extract marginal gains via marketplace sales, but only when risk tolerance is high.
True profit is not about chasing the highest price, but minimizing uncertainty, fee drag, and downgrade exposure.
Battery Longevity Science: Charging Habits That Preserve Long-Term Value
Battery health is not only a usability issue but a direct determinant of resale price. According to major Japanese buyback operators such as Sofmap’s Raku-Uru, the 80% maximum capacity threshold functions as a practical pricing boundary in the secondary market. Devices above 80% typically avoid major deductions, while those below it often face steep depreciation.
Understanding the science behind lithium-ion degradation allows you to actively protect long-term asset value. Battery aging occurs through two primary mechanisms: cycle aging (charge and discharge use) and calendar aging (time, heat, and high voltage exposure). Both are strongly influenced by daily charging behavior.
High state of charge and high temperature are the two biggest accelerators of lithium-ion degradation. Managing these factors is the most effective way to preserve resale value over a 2–3 year ownership cycle.
Apple and other manufacturers implement optimized charging features because keeping a battery at 100% for prolonged periods increases electrode stress. Research referenced by battery engineers and academic electrochemistry studies shows that lithium-ion cells stored near full charge degrade faster than those maintained at moderate levels.
The practical implication for resale strategy is clear: avoid extremes.
| Charging Habit | Chemical Impact | Resale Consequence |
|---|---|---|
| Frequent 0% depletion | Deep discharge stress | Accelerated capacity loss |
| Long periods at 100% | High voltage strain | Earlier drop below 80% |
| Heat during charging | Electrolyte degradation | Higher risk of major deduction |
| 20–80% range use | Reduced structural stress | Capacity preserved longer |
The widely cited “20–80% rule” is not a myth but a voltage management strategy. By keeping daily usage within this band when practical, you reduce time spent at peak voltage. Over a 24–36 month period, this can be the difference between selling at 82% health versus 78%—a gap that may shift your device from standard pricing to heavy discount territory.
Heat management is equally critical. Charging while gaming or under direct sunlight elevates internal temperature. According to manufacturer guidance and battery safety documentation, elevated temperatures significantly accelerate chemical aging. Simply removing a case during fast charging or avoiding high-load tasks while plugged in can measurably reduce stress.
Optimized charging features built into modern operating systems delay the final charge to 100% until just before expected unplug time. Enabling this function reduces overnight high-voltage exposure without sacrificing convenience. Over two years, such small optimizations compound into tangible resale advantages.
From an asset perspective, the goal is not to eliminate degradation—that is chemically impossible—but to control the slope of decline. Preserving battery health above 80% until your planned exit timing protects you from the most severe secondary-market penalties. Charging discipline, therefore, is not merely a technical best practice but a financial strategy embedded in daily behavior.
Secure Data Erasure: Factory Reset, Encryption, and NIST-Compliant Wiping
When preparing a smartphone for resale, secure data erasure is not just a courtesy but a financial and reputational safeguard. A device with incomplete data deletion can be rejected by buyers, downgraded in appraisal, or worse, become a source of personal information leakage. In a market where smartphones are treated as liquid assets, data sanitization is directly linked to resale eligibility and value preservation.
Modern smartphones rely on full-disk encryption by default. On iPhone and Android 10 or later, user data is encrypted with keys stored in secure hardware. When you perform a factory reset, the encryption keys are destroyed, rendering the stored data cryptographically inaccessible. According to guidance from the U.S. National Institute of Standards and Technology (NIST SP 800-88 Rev.1), this method is categorized as “Clear” when properly executed on encrypted devices.
| Method | Mechanism | Security Level (NIST) |
|---|---|---|
| Factory Reset (Encrypted Device) | Deletion of encryption keys | Clear |
| Software Overwrite | Data overwritten with new patterns | Purge (if validated) |
| Physical Destruction | Device dismantling or shredding | Destroy |
For individual sellers of recent smartphones, a properly executed factory reset is generally sufficient. However, there are critical procedural steps that must not be skipped. You should sign out of Apple ID or Google Account, disable activation locks such as “Find My iPhone,” and remove SIM and eSIM profiles. Failure to do so may result in the device being classified as unusable by buyers or carriers, effectively reducing its resale category.
Professional resale shops often go further. Major retailers use certified data erasure tools such as Blancco, which generate tamper-proof erasure reports. These processes align with NIST recommendations and provide auditable proof that data has been sanitized. For corporate devices or users handling sensitive business information, verified overwriting or certified erasure with documentation significantly reduces compliance risk.
Special attention should be paid to region-specific functions such as FeliCa-based mobile payment storage. In some cases, wallet credentials or transit data require manual de-registration before reset. If this step is overlooked, the device may be rejected at trade-in despite appearing fully initialized.
From an asset management perspective, encryption-enabled factory reset provides a high security-to-effort ratio for most users. For higher assurance scenarios, NIST-aligned overwriting or certified erasure services create an additional layer of protection. By aligning your data deletion method with the device’s encryption status and intended resale channel, you maximize both security and resale readiness.
Carrier Upgrade Programs as Financial Instruments: Residual Value and Risk Transfer
Carrier upgrade programs are often marketed as convenient ways to get the latest flagship every year, but financially they function as sophisticated instruments for residual value management and risk transfer.
In a market where flagship smartphones frequently exceed 200,000 yen, the uncertainty of future resale prices becomes a real economic variable for consumers. Programs such as NTT Docomo’s “Itsudemo Kaedoki Program” and au’s “Smartphone Otoku Program” effectively embed a guaranteed residual value into the contract.
From a financial perspective, this structure resembles a lease with a pre-agreed balloon payment that is waived upon return. The carrier is not simply selling hardware; it is underwriting future market risk.
| Element | Outright Purchase | Carrier Upgrade Program |
|---|---|---|
| Residual Value | Market-determined at resale | Pre-set and contractually defined |
| Price Risk | Consumer bears fluctuation risk | Carrier absorbs downside risk |
| Upside Potential | Consumer keeps surplus if resale is high | Limited, device must be returned |
The key variable is depreciation volatility. According to resale trend analyses reported by ITmedia, iPhones consistently maintain stronger secondary market performance than many Android flagships. When resale prices remain robust after 24 months, outright ownership can outperform upgrade programs because the user captures the market premium.
However, when depreciation accelerates, the economics invert. Android models historically exhibit sharper price declines in the used market, increasing the probability that actual resale value will fall below the carrier’s preset residual. In this case, returning the device effectively transfers the loss to the carrier.
This is the essence of risk transfer: the consumer exchanges upside potential for downside protection.
Financially, the residual amount functions like a floor price. If the market value after two years is lower than the guaranteed residual, the user benefits from returning the device. If it is higher, the opportunity cost becomes visible because the device cannot be freely sold at market price.
This structure also stabilizes cash flow. Instead of facing uncertain resale proceeds, the consumer pays predictable monthly installments with a known terminal condition. For risk-averse users or corporate procurement departments seeking budget certainty, this predictability has measurable value.
Importantly, carriers can assume this risk because they operate at scale. By aggregating thousands of returned devices, refurbishing them, and reselling through certified channels, they diversify individual price fluctuations. What is volatile for a single user becomes statistically manageable for a large operator.
In practical terms, the decision hinges on two questions: How confident are you in the device’s resale strength, and how much volatility are you willing to bear? If you choose a model with historically strong residual performance and maintain it in top condition, ownership preserves optionality. If depreciation risk is uncertain or historically steep, the upgrade program acts as insurance embedded in a payment plan.
Seen through this lens, carrier upgrade programs are not merely marketing incentives. They are structured financial tools that convert uncertain future asset values into contractually defined outcomes, reallocating residual risk from individual consumers to institutional balance sheets.
Understanding this mechanism allows you to treat your smartphone not just as hardware, but as a managed financial asset with explicit risk parameters.
Timing the Market: When Seasonal Demand and Product Launch Cycles Boost Prices
In the secondary smartphone market, price is not determined by condition alone. Timing is a decisive variable that can add or erase tens of thousands of yen in resale value. Seasonal demand spikes and product launch cycles repeatedly reshape supply–demand balance, and sellers who understand this rhythm consistently outperform the average market participant.
According to reporting by ITmedia Mobile and market data from MM Research Institute, Japan’s used smartphone market has grown for six consecutive years, reaching 3.53 million units in FY2025. This expansion means liquidity is high—but liquidity also amplifies seasonal price swings when demand concentrates in specific months.
High-Demand Windows in Japan
| Period | Demand Driver | Price Impact Tendency |
|---|---|---|
| March | New school year / job transitions | Stronger retail demand, firmer buyback prices |
| August–Early September | Pre–new iPhone launch cycle | Last peak before next-gen depreciation |
| Post-Launch (Sep–Oct) | Mass trade-ins flood supply | Downward pressure on prior models |
March is particularly strategic. Device upgrades align with life events such as university enrollment and corporate hiring. Retailers anticipate higher turnover and often strengthen procurement to secure inventory. In a tight supply window, well-maintained devices—especially iPhones, which account for roughly 70% of used market circulation according to ITmedia—benefit from more competitive pricing.
Equally critical is the product launch cycle. Apple’s annual iPhone announcement, typically in September, functions as a predictable shock event. Selling in late August or very early September allows owners to exit before trade-in volume surges depress the previous generation’s market price. Once the new model is officially unveiled, psychological depreciation accelerates even if hardware differences are incremental.
This phenomenon is behavioral as much as economic. Academic research in consumer psychology has shown that perceived obsolescence can influence willingness to pay more strongly than functional performance gaps. In practice, a two-year-old iPhone may lose disproportionate value immediately after a keynote event—not because it became slower overnight, but because buyer expectations shifted.
Android cycles differ. Flagship Android models often depreciate more rapidly over 12–24 months. For these devices, waiting for a seasonal peak may not compensate for steady month-to-month price erosion. In such cases, earlier resale—before the next flagship announcement by the same manufacturer—tends to preserve more value.
Another overlooked factor is campaign timing. As reported by K-Tai Watch, carriers such as NTT Docomo occasionally introduce limited-time trade-in boosts—for example, increasing iPhone 14 trade-in values by up to 17,000 yen. During such campaigns, the effective resale price can temporarily exceed open-market buyback offers, altering the optimal exit channel.
Ultimately, resale maximization is not about predicting the market perfectly. It is about aligning your sale with predictable demand expansions and avoiding supply gluts. By synchronizing device condition management with seasonal and launch-driven cycles, sellers transform volatility into opportunity rather than risk.
参考文献
- ITmedia Mobile:中古スマホ販売台数が6年連続で過去最高に、2029年度は400万台に迫る見通し
- ITmedia Mobile:2025年上半期の中古スマホ流通額ランキング発表 iPhoneが7割占め、AndroidはPixel 8aがトップ
- GEO:ゲオ・ゲオモバイル2025年 中古スマホ販売・買取ランキング
- IOSYS Buyback:査定基準について スマホ、携帯、iPhone買取なら【イオシス買取】
- IOSYS Buyback:iPhone14 買取価格表【イオシス買取】
- Impress Watch (ケータイ Watch):ドコモがiPhoneの下取り増額、「iPhone 14」で1.7万円増額
- Mercari:【2026年最新】iphone14 128gbの人気アイテム
- National Institute of Standards and Technology (NIST):Guidelines for Media Sanitization (SP 800-88 Rev.1)