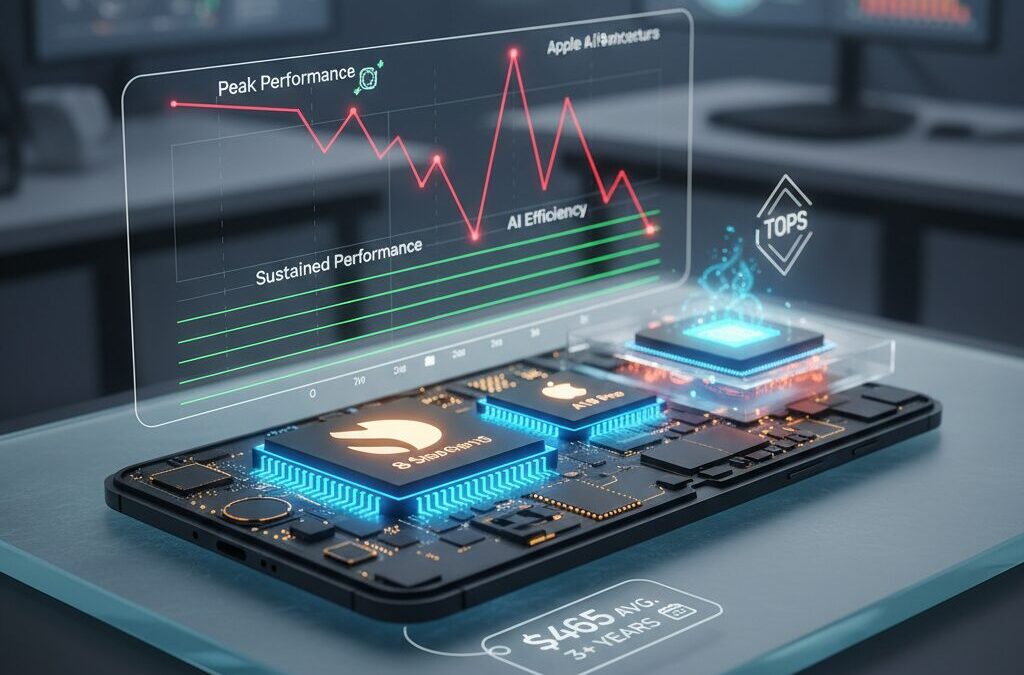
If you still judge a smartphone by its benchmark score alone, you may be making a costly mistake in 2026.
Flagship chips such as Snapdragon 8 Elite Gen 5 and Apple’s A19 Pro deliver record-breaking numbers in short tests, yet many devices throttle within minutes under real workloads. In some stress tests, performance drops below 50% of peak levels, and in extreme cases even underperforms previous generations.
At the same time, AI capabilities measured in TOPS, rising average selling prices reaching around $465 globally, and longer replacement cycles of over three years are reshaping what “performance” really means. In this article, we redefine smartphone evaluation standards for 2026, focusing on sustained performance, power efficiency, AI inference speed, and real-world usability so you can make a smarter buying decision.
- The End of Benchmark Supremacy: Why Peak Scores No Longer Reflect Real Performance
- A History of Benchmark Manipulation: From Huawei’s Hidden Modes to Samsung’s GOS Controversy
- How Modern Smartphones Detect and Optimize for Benchmark Apps
- Thermal Throttling Explained: Why Snapdragon 8 Elite Gen 5 Struggles Under Sustained Load
- Cooling Design Wars: Gaming Phones vs Thin Flagships and the 2–3x Stability Gap
- Apple A19 Pro vs Snapdragon 8 Elite Gen 5: Real-World Gaming Stability in ‘Where Winds Meet’
- AI Performance in 2026: Why TOPS Alone Is a Misleading Metric
- Inference Speed, Power Efficiency, and On-Device LLMs: The New AI Benchmarks That Matter
- Market Reality Check: Rising ASP, 3+ Year Upgrade Cycles, and the Shift Toward Practical Value
- Network Bottlenecks: Why 5G Speed Tests Mirror the Benchmark Illusion
- How to Evaluate a Smartphone in 2026: Stability Scores, Watt-Performance, and Ecosystem Fit
- 参考文献
The End of Benchmark Supremacy: Why Peak Scores No Longer Reflect Real Performance
For years, smartphone performance has been judged by a single number. The higher the score in Geekbench, AnTuTu, or 3DMark, the better the device was assumed to be. That logic no longer holds true in 2026.
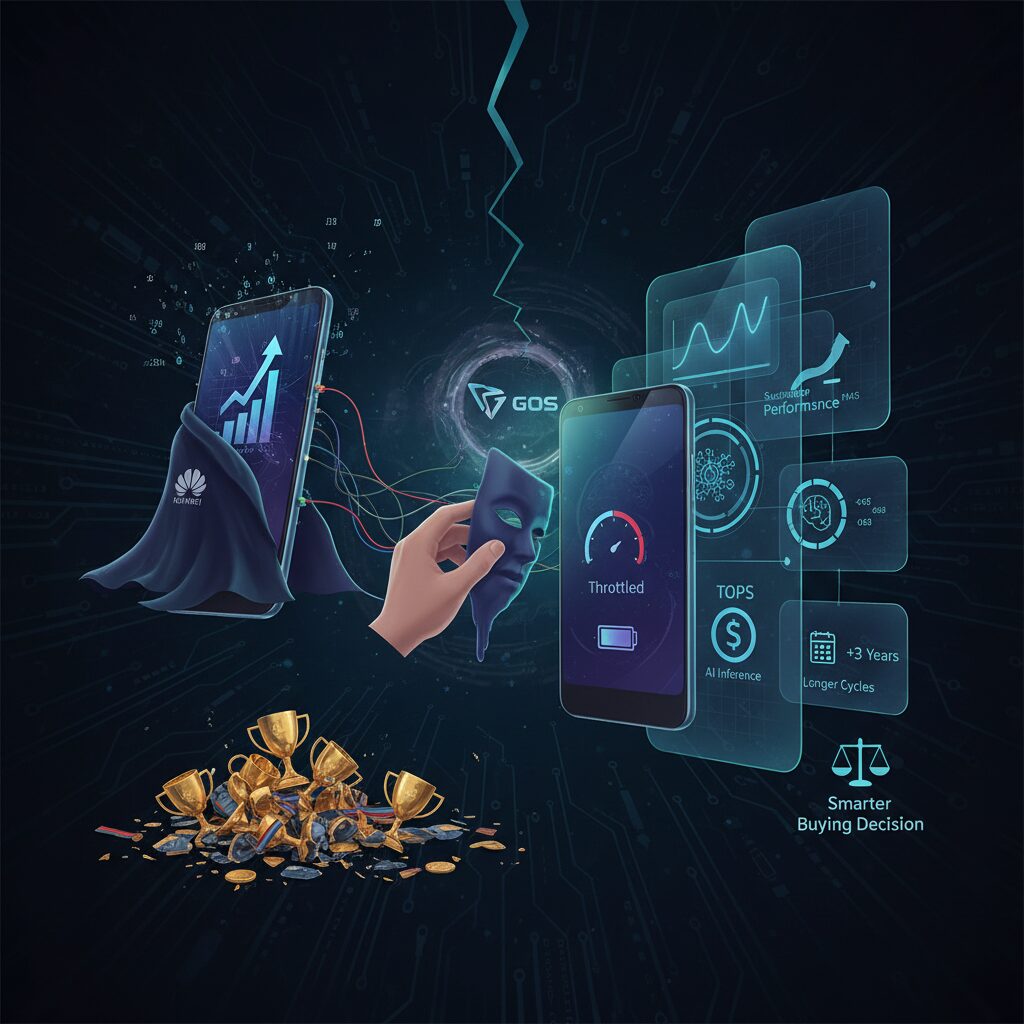
Peak benchmark scores increasingly reflect a manufacturer’s tuning strategy, not the real-world experience users actually get. As synthetic tests became marketing weapons, optimization practices evolved to maximize short bursts of performance that rarely resemble daily usage.
According to multiple industry investigations, several major brands have implemented app-detection mechanisms that temporarily lift thermal and power limits only when benchmark software is running. Historical cases involving Huawei, Samsung’s Game Optimizing Service, and Xiaomi illustrate how widespread this practice has been.
| Brand | Optimization Method | Impact |
|---|---|---|
| Huawei (2018) | Hidden performance mode triggered by benchmark detection | Inflated peak scores |
| Samsung (2022) | App throttling via GOS, benchmarks excluded | Benchmarks ran unrestricted |
| Xiaomi (2022) | App-identifier-based throttling | Game performance reduced vs benchmark mode |
In some verified tests, simply renaming Geekbench to mimic a popular game caused single-core scores to drop by around 30 percent. That gap exposes a structural problem: the benchmark result represents an artificial state, not sustainable operation.
Thermal constraints amplify this distortion. Modern flagship chips such as Snapdragon 8 Elite Gen 5 can produce extraordinary initial scores, yet stress testing shows performance falling below 30 percent of peak within minutes under sustained load. This occurs because devices must prevent surface temperatures from exceeding safe thresholds.
A phone that wins a benchmark chart may deliver worse long-session gaming performance than its predecessor. Sustained stability, not first-run output, determines actual usability.
Independent testing with demanding titles like Where Winds Meet demonstrates this divergence clearly. Even devices equipped with active cooling solutions have exhibited more frame drops and instability than competitors with lower advertised peak scores but better power efficiency.
The same pattern is emerging in AI evaluation. Industry focus on TOPS figures—often exceeding 100 TOPS in 2026—does not guarantee fast on-device inference. Real responsiveness depends on memory bandwidth, software optimization, and power efficiency. Microsoft’s Copilot+ requirement of 40 TOPS illustrates a baseline, but user experience hinges on latency thresholds such as sub-20ms inference times.
Market behavior confirms the shift. IDC projects average selling prices rising to around $465, while NielsenIQ reports that 71 percent of consumers now keep devices for more than three years. In a longer ownership cycle, stability and efficiency matter more than short-lived benchmark dominance.
As synthetic benchmarks become easier to game and harder to interpret, informed buyers increasingly look beyond headline numbers. In 2026, benchmark supremacy no longer defines technological leadership. Sustainable performance, thermal integrity, and efficiency under real workloads do.
A History of Benchmark Manipulation: From Huawei’s Hidden Modes to Samsung’s GOS Controversy
The manipulation of smartphone benchmarks is not a recent anomaly but a recurring pattern that has evolved over the past decade. What began as isolated incidents has gradually exposed a structural conflict between marketing-driven peak scores and real-world user experience. For performance-focused readers, understanding this history is essential to interpreting today’s numbers critically.
One of the most prominent early cases emerged in 2018, when Huawei devices such as the P20 and P20 Pro were found to activate a hidden “performance mode” upon detecting benchmark applications like 3DMark. According to investigations reported by HardwareZone and later confirmed by UL, the company behind 3DMark, the devices lifted normal power and thermal limits only during benchmark runs. This allowed them to post significantly higher scores than in everyday use, while generating substantially more heat.
UL responded by delisting multiple Huawei models from its official rankings—an unusually strong move that signaled how seriously the benchmarking community viewed the issue. The core problem was not raw performance itself, but the selective unlocking of performance only when a benchmark was detected.
| Year | Company | Method |
|---|---|---|
| 2018 | Huawei | Hidden performance mode triggered by benchmark detection |
| 2021 | OnePlus | Selective throttling of common apps such as browsers |
| 2022 | Samsung | GOS limited thousands of apps while excluding benchmarks |
The controversy did not end there. In 2022, Samsung faced intense backlash over its Game Optimizing Service (GOS). Investigations revealed that GOS restricted performance in over 10,000 popular applications—including games—while exempting benchmark apps from those limits. As reported by multiple Android-focused media outlets, this discrepancy led to public criticism and a formal apology from Samsung’s leadership.
What made the GOS case particularly significant was its scale. Unlike Huawei’s hidden toggle, Samsung’s system operated continuously at the software level, dynamically adjusting CPU and GPU behavior. Yet benchmarks were effectively whitelisted. Consumers were shown one version of performance in reviews and a different version in daily usage.
Subsequent reports, including community investigations discussed widely in Android forums and covered by outlets such as Android Police, indicate that performance shaping has become increasingly sophisticated. Instead of simple app-name detection, some manufacturers now integrate adjustments at the kernel level, blending thermal management, frequency scaling, and workload recognition.
This historical pattern reveals a consistent theme: benchmark scores became marketing assets, incentivizing optimization for short, synthetic tests rather than sustained workloads. Each scandal eroded trust incrementally. By the mid-2020s, skepticism toward headline scores had grown among enthusiast communities and even mainstream buyers.
The lesson from Huawei’s hidden modes to Samsung’s GOS controversy is clear. When performance is selectively amplified or suppressed depending on the application, benchmark numbers cease to function as neutral measurements. They become curated demonstrations. For readers who care deeply about performance integrity, this history explains why raw scores in 2026 are increasingly viewed not as objective truth, but as context-dependent outputs shaped by software intent.
How Modern Smartphones Detect and Optimize for Benchmark Apps
Modern smartphones no longer treat benchmark apps as neutral workloads. Instead, many devices actively identify when a synthetic test is running and temporarily adjust system behavior to produce higher scores. This process is commonly known as a “whitelist” approach, where specific package names such as Geekbench or 3DMark are recognized at the system level.
According to investigations reported by UL and multiple industry outlets, manufacturers have embedded detection logic deep inside the firmware and even at the kernel level. Once a benchmark app is detected, the device can relax thermal thresholds, raise power limits, and allow higher CPU and GPU frequencies than would normally be permitted in daily use.
This means the score you see may reflect a special performance mode that is never activated during real-world gaming, browsing, or AI workloads.
Typical Optimization Mechanisms
| Technique | How It Works | User Impact |
|---|---|---|
| App Whitelisting | Detects benchmark package names and unlocks higher frequency ceilings | Artificially inflated peak scores |
| Dynamic Voltage Scaling Overrides | Temporarily increases voltage and power draw beyond normal limits | Higher short bursts, more heat |
| Thermal Policy Adjustment | Delays throttling triggers during recognized tests | Improved stability scores in short runs |
Historical cases illustrate how systematic this behavior has become. In 2018, Huawei devices were found to activate a hidden performance mode during 3DMark runs, prompting UL to delist certain models. Later, Samsung’s Game Optimizing Service controversy revealed that thousands of regular apps were throttled while benchmark apps were excluded from restrictions.
More recently, testing cited by industry observers showed that renaming Geekbench to mimic a popular game could reduce single-core scores by around 30 percent and multi-core scores by about 15 percent on certain Xiaomi models. This indicates that performance profiles are tightly linked to app identifiers rather than actual workload intensity.
The detection is not about measuring demand in real time; it is about recognizing the label of the app.
Technically, this is achieved through package name monitoring, predefined performance profiles, and scheduler-level tuning. When the system framework flags a recognized benchmark, CPU governors may switch to aggressive modes, GPU clocks may remain pinned at higher states, and thermal daemons may postpone throttling decisions for the duration of the test.
From a marketing standpoint, the incentive is obvious. Synthetic benchmarks are easy to compare and widely reported. A few percentage points in Geekbench or AnTuTu can influence headlines and consumer perception. However, as coverage from Android-focused media has emphasized, this optimization strategy widens the gap between peak numbers and sustained, real-world performance.
Understanding how detection works empowers advanced users to interpret scores critically. When a device delivers exceptional first-run results but struggles under prolonged load, it is often a sign that benchmark-specific optimization is in play rather than a reflection of balanced engineering.
In 2026, benchmark detection is no longer an anomaly but a built-in layer of performance management that every informed buyer should factor into their evaluation.
Thermal Throttling Explained: Why Snapdragon 8 Elite Gen 5 Struggles Under Sustained Load

Thermal throttling is not a software bug or a conspiracy theory. It is a physical safeguard built into every modern smartphone. When a chip like the Snapdragon 8 Elite Gen 5 reaches unsafe temperatures, the system automatically reduces clock speeds and voltage to prevent damage and keep surface temperatures within user-safe limits.
According to early stress tests reported by Android Headlines and PhoneArena, devices powered by Snapdragon 8 Elite Gen 5 can drop to below 30% of their peak performance after only a few minutes of sustained load. This reduction is triggered when surface temperatures approach or exceed 50°C, a threshold manufacturers try to avoid for safety and comfort reasons.
The key issue is not peak power, but how long that power can be maintained.
| Phase | Performance Level | Thermal State |
|---|---|---|
| Initial Benchmark Run | Near 100% peak | Rapid heat buildup |
| 3–5 Minutes Load | ~50–70% | Thermal limits approaching |
| Sustained Gaming / Stress Test | Below 30% reported in some models | Active throttling engaged |
This behavior explains why short synthetic benchmarks often show extraordinary numbers, while real-world gaming sessions tell a different story. Benchmarks typically measure the first phase, before thermal saturation occurs. Sustained workloads such as 3D gaming, AI upscaling, or 4K video processing operate in the third phase, where throttling dominates.
What makes Snapdragon 8 Elite Gen 5 particularly vulnerable is its aggressive peak design philosophy. Reports from Reddit user testing and Android-focused publications indicate that its high power draw generates substantial heat in a very short time. Even devices with advanced cooling, including vapor chambers or active fans, struggle to maintain full clocks for extended periods.
In some cases, sustained performance has been observed to fall below that of previous-generation chips once throttling stabilizes. This inversion is critical. It means that a newer chip can benchmark higher yet deliver weaker long-session consistency.
Thermal throttling is not a flaw of Qualcomm alone. It is a structural limitation of fitting desktop-class ambition into a handheld thermal envelope.
Smartphone chassis thickness, internal layout, graphite layers, and vapor chamber size all determine how quickly heat can be dispersed. Thin flagship phones often throttle earlier because manufacturers prioritize surface comfort around 40–42°C. Gaming phones tolerate higher temperatures, sometimes exceeding 55°C, to preserve performance longer.
The result is a widening gap between advertised capability and sustained reality. When evaluating Snapdragon 8 Elite Gen 5 devices, the meaningful metric is no longer the highest score achieved once, but the stability curve across repeated runs. Stress test stability percentages tell a far more honest story than single-pass results.
Understanding thermal throttling shifts the conversation from “How fast is it?” to “How stable is it under pressure?” In 2026, that distinction defines real-world performance.
Cooling Design Wars: Gaming Phones vs Thin Flagships and the 2–3x Stability Gap
In 2026, the real performance battlefield is no longer chip vs chip, but cooling design vs cooling design. When the same Snapdragon 8 Elite Gen 5 is installed in different bodies, the gap in sustained performance can reach two to three times, according to stress test reports covered by PhoneArena and AndroidHeadlines.
Peak scores may look similar on day one. However, once you run a 20-loop 3DMark Wildlife Extreme stress test, the story changes dramatically.
Cooling architecture now determines whether a flagship performs like a powerhouse—or throttles into mediocrity within minutes.
| Device Type | Cooling System | 3DMark Stability | Surface Temp (Load) |
|---|---|---|---|
| Gaming Phone (e.g., REDMAGIC 11 Pro) | Active fan (24,000 RPM) + liquid cooling + large vapor chamber | ~80% | ~56°C |
| Mainstream Flagship | Passive cooling + standard heat spreader | ~48% or lower | ~44°C |
| Ultra-thin Flagship | Minimal thermal headroom | Below 30% | ~40–42°C |
The numbers reveal a brutal trade-off. Gaming phones tolerate higher surface temperatures to preserve clock speeds. Thin flagships, designed for comfort and slim aesthetics, throttle early to keep external temperatures manageable.
This design philosophy explains why some Snapdragon 8 Elite Gen 5 devices reportedly drop to under 30% of their initial performance after just minutes of sustained load. The chip is not the only variable—the chassis is.
What makes this gap even more striking is that both categories often advertise identical processors. Yet in long gaming sessions or AI rendering workloads, the difference between 80% stability and 30% stability is not incremental—it is transformative.
An 80% stability score means relatively consistent frame pacing. A 30% score means severe throttling, frame drops, and potential stutter.
Industry observers have also noted a paradox. Even with aggressive active cooling, some high-TDP Android devices struggle to match the sustained efficiency of Apple’s A19 Pro under demanding titles like Where Winds Meet, as reported by Wccftech. This suggests that thermal design is not just about hardware mass, but also about power efficiency per watt.
Thin flagships are optimized for daily comfort: lighter weight, cooler touch, silent operation. Gaming phones are engineered for endurance: airflow, thicker frames, visible vents. Neither approach is objectively superior—they serve different priorities.
But for performance-focused users, the implication is clear. Synthetic benchmark scores measured in short bursts conceal the thermal cliff that appears after five to ten minutes of load.
In 2026, the real performance war is not fought at peak frequency—it is fought at the 15-minute mark.
Apple A19 Pro vs Snapdragon 8 Elite Gen 5: Real-World Gaming Stability in ‘Where Winds Meet’
When we move beyond synthetic scores and load up an actual open-world title like Where Winds Meet, the gap between peak performance and sustained stability becomes impossible to ignore. According to Wccftech’s early hands-on comparison, the Apple A19 Pro and Snapdragon 8 Elite Gen 5 deliver very different experiences once the session extends beyond a few benchmark loops.
In a controlled gameplay test, the iPhone 17 Pro Max powered by A19 Pro demonstrated higher frame-time consistency, while the REDMAGIC 11 Pro with Snapdragon 8 Elite Gen 5 showed more aggressive fluctuations despite its active cooling system.
| Metric | A19 Pro (iPhone 17 Pro Max) | 8 Elite Gen 5 (REDMAGIC 11 Pro) |
|---|---|---|
| 1% Lows | 57 FPS | 48 FPS |
| Resolution Stability | High, sustained | Moderate, more dynamic shifts |
| Frame Drops | Rare | Noticeable stutter |
The most telling figure is the 1% low result. While average FPS may look competitive on paper, 1% lows reveal how often the game “breaks immersion.” With 57 FPS versus 48 FPS, the A19 Pro maintains tighter frame pacing under heavy scenes such as large-scale combat or fast traversal across dense environments.
What makes this comparison especially compelling is cooling. The REDMAGIC 11 Pro integrates an active fan and a substantial vapor chamber, hardware typically associated with sustained gaming dominance. Yet even with this physical advantage, it exhibits more visible stutter during extended play.
This aligns with broader thermal findings reported by Android-focused outlets, which note that Snapdragon 8 Elite Gen 5 can throttle sharply under sustained load. In contrast, Apple’s silicon strategy emphasizes power efficiency. Reports indicate that A19 Pro consumes roughly 30% less power under full load than its Snapdragon rival, which directly translates into lower thermal buildup and fewer emergency frequency cuts.
In practical gameplay, this means fewer sudden drops when particle effects spike or when the GPU pipeline is saturated. Instead of chasing the highest instantaneous clock speeds, A19 Pro appears tuned for predictable output across 20–30 minute sessions.
Another overlooked factor is resolution scaling behavior. During intense scenes, the Snapdragon-powered device tends to adjust rendering resolution more aggressively to stabilize thermals. The A19 Pro, by comparison, holds higher effective resolution more consistently, preserving environmental detail in foliage and distant architecture.
For gamers, stability is not about winning a benchmark chart. It is about whether sword clashes, camera pans, and open-world traversal feel uninterrupted. In Where Winds Meet, the evidence suggests that Apple’s efficiency-first design delivers a smoother long-session experience, even against a Snapdragon device engineered explicitly for gaming.
This real-world result reinforces a critical 2026 lesson: peak numbers fade within minutes, but sustained frame pacing defines the actual experience in demanding AAA mobile titles.
AI Performance in 2026: Why TOPS Alone Is a Misleading Metric
In 2026, AI performance has become the centerpiece of smartphone marketing. The number most aggressively promoted is TOPS, or Tera Operations Per Second. At first glance, a chip boasting 100 TOPS appears vastly superior to one rated at 40 TOPS. However, TOPS alone does not guarantee real-world AI responsiveness, efficiency, or usability.
The industry’s shift toward on-device AI accelerated after Microsoft defined 40 TOPS of NPU performance as the baseline for Copilot+ certification. As reported in HP’s AI performance analysis, this threshold was intended to ensure meaningful local inference capability. Yet in practice, many smartphones now advertise far beyond 100 TOPS without delivering proportionally better user experiences.
The problem lies in what TOPS actually measures. It reflects theoretical peak throughput under ideal conditions, often using low-precision data types. It does not account for memory bandwidth, sustained power limits, thermal constraints, or software optimization layers that heavily influence real inference speed.
| Metric | What It Represents | What It Ignores |
|---|---|---|
| TOPS | Theoretical peak AI operations per second | Thermals, memory limits, sustained load |
| Inference Latency | Real response time (e.g., <20ms target) | Peak burst capability |
| Power Efficiency | Watts consumed during AI tasks | Marketing headline numbers |
For example, industry guidance in 2026 suggests that real-time AI interactions require inference latency below 20 milliseconds. A device with 120 TOPS that throttles under heat may respond slower than a 60 TOPS chip operating efficiently within thermal limits. As seen in broader SoC testing trends, sustained performance frequently diverges from advertised peaks.
Power efficiency further complicates the picture. NPUs are promoted as dramatically more efficient than CPU or GPU-based AI processing, often reducing consumption to roughly 2–3W compared to 15–45W in non-accelerated scenarios. But if firmware prioritizes short benchmark bursts, energy draw can spike, negating battery-life advantages. In daily use—background transcription, AI photo enhancement, noise suppression—steady efficiency matters more than theoretical throughput.
Memory architecture also plays a decisive role. Running a 13B-parameter local language model requires not just compute units, but sufficient bandwidth and optimized model quantization. A high-TOPS NPU paired with constrained memory pipelines can bottleneck, producing slower outputs despite impressive specifications.
Independent testing increasingly reveals that devices with moderate TOPS but superior software stacks and tighter hardware integration outperform higher-rated competitors in sustained AI workloads. This mirrors findings across the broader performance landscape, where theoretical peaks fail to predict stability.
For AI-focused buyers in 2026, the smarter evaluation framework includes sustained inference latency, watt-per-inference efficiency, and real model execution capability. Without these context metrics, TOPS functions primarily as a marketing abstraction rather than a reliable indicator of intelligence at your fingertips.
Inference Speed, Power Efficiency, and On-Device LLMs: The New AI Benchmarks That Matter
In 2026, smartphone performance is no longer defined by peak CPU or GPU scores. The real battleground has shifted to inference speed, power efficiency, and the ability to run large language models directly on the device. These are the benchmarks that now determine whether a phone feels genuinely intelligent or merely looks powerful on paper.
As HP’s AI performance analysis explains, traditional metrics such as TOPS (Tera Operations Per Second) describe theoretical throughput, not user experience. A chip may advertise 100 TOPS, yet still feel sluggish if memory bandwidth, thermal limits, or software optimization become bottlenecks.
The practical question is simple: how fast does the device respond when AI is actually working?
Inference Speed: The 20ms Threshold
For real-time AI tasks such as voice transcription, background blur, or on-device assistants, latency matters more than peak throughput. Industry analysis around Copilot+ class devices indicates that sub-20ms response time is widely considered the threshold for “instantaneous” interaction.
When inference exceeds that window, users begin to perceive delay. This is especially critical for AI agents expected to operate continuously in the background.
Unlike synthetic benchmarks, inference latency reflects the combined efficiency of NPU design, memory access, and software stack maturity.
Power Efficiency: The Hidden Multiplier
Running AI on CPU or GPU can draw between 15W and 45W under load, according to industry technical disclosures. In contrast, dedicated NPUs typically operate around 2–3W for comparable AI workloads.
This 10x to 15x efficiency gap is not theoretical—it directly impacts battery life and thermal stability.
Devices that rely heavily on general-purpose cores for AI may post impressive benchmark bursts, yet rapidly throttle or drain battery during sustained tasks.
| Execution Path | Typical Power Draw | User Impact |
|---|---|---|
| CPU/GPU-based AI | 15–45W | Heat buildup, battery drain |
| Dedicated NPU | 2–3W | Stable, sustained AI features |
In practical terms, this determines whether features like live translation or generative photo editing remain usable after 10 minutes—or trigger thermal throttling.
On-Device LLMs: The 13B Parameter Frontier
Another emerging benchmark is the ability to run approximately 13-billion-parameter class language models locally. This class of model approaches cloud-level conversational capability while preserving privacy and reducing network dependency.
However, raw TOPS numbers alone do not guarantee smooth execution. Memory bandwidth and RAM capacity play decisive roles in determining whether a model runs fluidly or stalls.
A phone capable of stable, offline LLM inference without excessive battery drain represents a fundamentally different tier of intelligence.
Importantly, none of these metrics are captured by legacy tools like Antutu or Geekbench. They do not measure latency under AI workloads, sustained NPU efficiency, or real-world model execution.
In 2026, the smartest device is not the one with the highest synthetic score. It is the one that responds in under 20 milliseconds, maintains low wattage under load, and runs meaningful AI models locally without compromise.
That is the benchmark that truly matters now.
Market Reality Check: Rising ASP, 3+ Year Upgrade Cycles, and the Shift Toward Practical Value
The smartphone market in 2026 is no longer driven by shipment growth alone. According to IDC, global shipments hover around 1.25 billion units, with only marginal year‑over‑year changes, yet total market value continues to rise. The key driver is a steady increase in average selling price (ASP), projected to reach around $465.
This shift fundamentally changes how consumers evaluate performance. When a device costs significantly more than it did a few years ago, buyers do not upgrade for a 10% benchmark gain. They expect durability, stability, and real utility over multiple years of ownership.
| Indicator | 2025 | 2026 Outlook |
|---|---|---|
| Global Shipments | ~1.25B (+1.5%) | Slight decline (-0.9%) |
| Average Selling Price | Rising | ~$465 |
| Upgrade Cycle | ~3 years | Lengthening further |
NielsenIQ reports that 71% of consumers now keep their smartphones for three years or longer. This is a structural change, not a temporary reaction. Longer ownership cycles reduce the importance of peak launch-day scores and elevate the importance of sustained performance, battery health, and long-term software support.
A rising ASP combined with 3+ year upgrade cycles forces a redefinition of value. Consumers are effectively amortizing their purchase over a longer period, which makes reliability and ecosystem integration more important than headline performance numbers.
In markets such as Japan, where currency pressure and component costs have pushed retail prices higher, purchasing decisions have become more cautious. Coverage by major business media notes that 2026 is expected to accelerate AI agent integration into daily workflows. Buyers therefore evaluate devices based on how effectively they support productivity and quality of life, not how high they score in synthetic tests.
This practical shift manifests in several ways. Users ask whether AI features run locally without draining the battery, whether thermal throttling affects video calls or gaming sessions after 20 minutes, and whether software updates are guaranteed for the majority of the ownership period. These questions directly connect to lived experience.
Premiumization also narrows the tolerance for disappointment. If a flagship device throttles heavily under load or ages poorly after two OS updates, the perceived value collapses. In a slower replacement cycle, negative experiences linger longer in the market narrative.
The result is a consumer mindset that prioritizes functional longevity. Performance is no longer a short sprint measured in peak numbers. It is a multi‑year contract between hardware efficiency, thermal design, battery resilience, and software optimization.
For brands, this means marketing based solely on benchmark leadership is increasingly ineffective. Practical value, measured in years of smooth daily use, has become the real competitive battlefield.
Network Bottlenecks: Why 5G Speed Tests Mirror the Benchmark Illusion
Even the fastest smartphone becomes ordinary the moment it touches a congested network. This is why 5G speed tests often resemble the benchmark illusion we see in chip performance. They measure peak throughput under ideal conditions, not the speed you consistently experience while commuting, gaming, or uploading 4K video.
According to H2 2025 network testing by Ookla and RootMetrics, competition among T-Mobile, Verizon, and AT&T intensified, yet a critical gap remained between theoretical maximum speeds and real-world consistency. Median download speeds could look spectacular on paper, but availability and reliability varied significantly by location and time of day.
The result is simple: a headline speed does not guarantee a stable user experience.
| Metric | What It Shows | User Impact |
|---|---|---|
| Peak Download Speed | Maximum burst throughput | Impressive in tests, rarely sustained |
| Median Speed | Typical performance across users | Closer to daily experience |
| Latency & Reliability | Response time and connection stability | Crucial for gaming, video calls, AI services |
For example, T-Mobile recorded strong median download results in late 2025 testing, yet those figures did not automatically translate into uniform nationwide consistency. In some regions, Verizon or AT&T demonstrated stronger reliability or lower latency, which directly affects video conferencing stability and cloud gaming responsiveness.
This mirrors synthetic CPU benchmarks. A device may hit extraordinary numbers in a controlled lab environment, just as a carrier can demonstrate multi‑gigabit 5G under ideal spectrum aggregation. However, urban congestion, building penetration loss, and backhaul capacity quickly become limiting factors.
Network bottlenecks shift the performance ceiling from the device to the infrastructure.
Consider cloud-based AI processing or large app downloads. Even if your smartphone supports advanced 5G modems, throughput can collapse during peak hours when cell sectors saturate. Latency spikes of just tens of milliseconds can disrupt real-time gaming or AR applications, despite impressive advertised bandwidth.
Authoritative industry measurements consistently emphasize consistency over peak metrics. Median speeds, 5G availability percentages, and latency distributions provide a more honest picture than single best-case results. In practice, stable 200–400 Mbps with low jitter often feels faster than sporadic 1 Gbps bursts followed by slowdowns.
The illusion persists because speed tests are short. Like a benchmark run that lasts under a minute, they rarely capture thermal limits, congestion cycles, or mobility handoffs between cells. Once you start moving on a train or enter a dense indoor space, real-world constraints dominate.
For performance-focused users, the key takeaway is clear. Evaluate networks the same way you evaluate chips: prioritize sustained performance, latency stability, and coverage consistency. Only then does the promise of 5G translate into tangible, everyday speed rather than another impressive but fleeting number.
How to Evaluate a Smartphone in 2026: Stability Scores, Watt-Performance, and Ecosystem Fit
Evaluating a smartphone in 2026 requires a mindset shift. Peak benchmark scores no longer tell you how a device behaves in real life. What matters now is how stable it remains under pressure, how efficiently it converts watts into meaningful work, and how well it fits into your broader digital ecosystem.
If you still judge a phone by a single Geekbench or AnTuTu score, you are likely measuring marketing performance, not user experience.
1. Stability Scores Over Peak Numbers
Thermal throttling has become the defining constraint of flagship chips. Stress tests reported by PhoneArena and Android Headlines show that some Snapdragon 8 Elite Gen 5 devices drop below 30% of peak performance after only minutes of sustained load. That gap is invisible in one-shot benchmarks.
Instead, you should focus on loop-based stress metrics such as 3DMark’s Wild Life Extreme Stability score. A device with an 80% stability rating will feel dramatically more consistent than one hovering around 40–50%, even if their initial scores look similar.
| Metric | What It Reveals | Why It Matters in 2026 |
|---|---|---|
| Peak Score | Short burst capability | Often boosted by aggressive thermal policies |
| Stability % | Performance over 15–20 loops | Reflects gaming, AI, and video workloads |
| Surface Temperature | Thermal ceiling | Impacts comfort and sustained speed |
For gamers and creators, the 1% low frame rate is often more telling than the average FPS. Real-world testing of titles like Where Winds Meet shows that frame consistency can outweigh raw horsepower, particularly when thermal headroom is limited.
2. Watt-Performance and AI Efficiency
In 2026, AI workloads run constantly in the background. According to industry guidance around NPU evaluation, inference latency below 20ms defines true real-time responsiveness. But speed alone is insufficient.
Watt-performance has become the new benchmark currency. An NPU delivering 2–3W during inference versus 15–45W on CPU/GPU fallback can mean hours of battery difference over a day of AI-assisted photography, transcription, and on-device LLM queries.
TOPS figures above 40 or even 100 may look impressive, especially as Copilot+ style requirements push higher NPU targets. Yet without sufficient memory bandwidth and software optimization, those numbers rarely translate into proportional gains. Always look for measured power draw during sustained AI tasks, not just theoretical throughput.
3. Ecosystem Fit as a Performance Multiplier
Performance is no longer isolated to the handset. As IDC and NIQ report lengthening replacement cycles and rising average selling prices, buyers expect a device to remain productive for three years or more. That shifts the evaluation criteria toward integration.
Ask how the smartphone interacts with your earbuds, smartwatch, tablet, laptop, and cloud AI agent. Does it enable seamless file handoff? Are AI features processed locally for privacy, or do they rely heavily on network quality?
Network testing from Ookla and RootMetrics has shown that theoretical 5G speed leadership does not always equate to consistent real-world reliability. The same principle applies to phones: consistent ecosystem performance beats isolated headline speed.
In 2026, the best smartphone is not the one with the highest score, but the one that sustains performance, maximizes work per watt, and amplifies the tools you already use.
参考文献
- PhoneArena:The Snapdragon 8 Elite Gen 5 is fast, but not all phones can handle the heat
- HardwareZone Singapore:Huawei caught cheating on benchmark tests, opens up performance mode to users
- Android Headlines:Snapdragon 8 Elite Gen 5 Thermals Force Performance Throttling
- Wccftech:A19 Pro Delivers Better Stability Than Snapdragon 8 Elite Gen 5 In Where Winds Meet Comparison
- IDC:Smartphone Market Share
- NielsenIQ:Navigating the 2025 Smartphone Market: Key Insights for Manufacturers, Retailers and Mobile Operators
- PhoneArena:T-Mobile vs Verizon vs AT&T: H2 2025 tests crown new overall US champion, same old 5G leader